VircoManufacturing VIRC full analysis,charts,indicators,moving averages,SMA,DMA,EMA,ADX,MACD,RSIVirco Manufacturing VIRC WideScreen charts, DMA,SMA,EMA technical analysis, forecast prediction, by indicators ADX,MACD,RSI,CCI USA stock exchange
operates under Consumer Durables sector & deals in Industrial Specialties
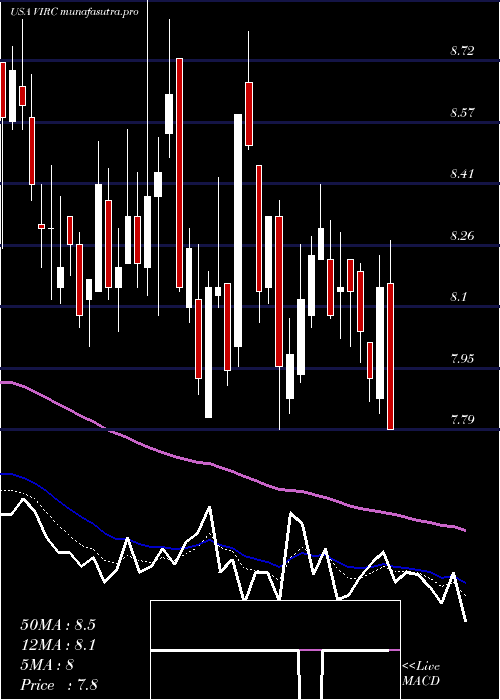
Daily price and charts and targets VircoManufacturing Strong Daily Stock price targets for VircoManufacturing VIRC are 7.36 and 7.53 | Daily Target 1 | 7.23 | | Daily Target 2 | 7.31 | | Daily Target 3 | 7.3966666666667 | | Daily Target 4 | 7.48 | | Daily Target 5 | 7.57 |
Daily price and volume Virco Manufacturing
| Date |
Closing |
Open |
Range |
Volume |
Mon 20 October 2025 |
7.40 (1.37%) |
7.38 |
7.31 - 7.48 |
0.9749 times |
Fri 17 October 2025 |
7.30 (3.25%) |
7.00 |
7.00 - 7.50 |
1.2738 times |
Thu 16 October 2025 |
7.07 (1.29%) |
6.98 |
6.86 - 7.11 |
1.1329 times |
Wed 15 October 2025 |
6.98 (-0.29%) |
7.06 |
6.76 - 7.06 |
0.9117 times |
Tue 14 October 2025 |
7.00 (3.86%) |
6.67 |
6.67 - 7.05 |
0.9374 times |
Mon 13 October 2025 |
6.74 (0.75%) |
6.80 |
6.65 - 6.86 |
1.337 times |
Fri 10 October 2025 |
6.69 (-1.91%) |
6.83 |
6.67 - 7.05 |
0.8718 times |
Thu 09 October 2025 |
6.82 (-3.54%) |
7.07 |
6.73 - 7.07 |
0.9808 times |
Wed 08 October 2025 |
7.07 (2.02%) |
6.93 |
6.86 - 7.12 |
0.6539 times |
Tue 07 October 2025 |
6.93 (-4.15%) |
7.25 |
6.93 - 7.34 |
0.9257 times |
Mon 06 October 2025 |
7.23 (-2.95%) |
7.40 |
7.18 - 7.46 |
1.3956 times |
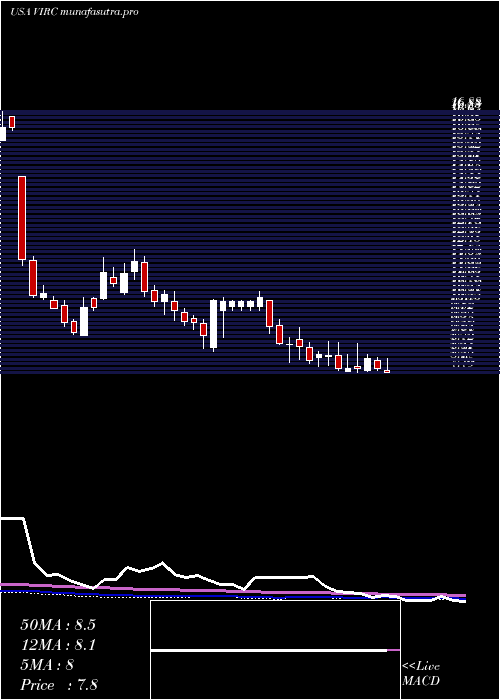
Weekly price and charts VircoManufacturing Strong weekly Stock price targets for VircoManufacturing VIRC are 7.36 and 7.53 | Weekly Target 1 | 7.23 | | Weekly Target 2 | 7.31 | | Weekly Target 3 | 7.3966666666667 | | Weekly Target 4 | 7.48 | | Weekly Target 5 | 7.57 |
Weekly price and volumes for Virco Manufacturing
| Date |
Closing |
Open |
Range |
Volume |
Mon 20 October 2025 |
7.40 (1.37%) |
7.38 |
7.31 - 7.48 |
0.2758 times |
Fri 17 October 2025 |
7.30 (9.12%) |
6.80 |
6.65 - 7.50 |
1.5821 times |
Fri 10 October 2025 |
6.69 (-10.2%) |
7.40 |
6.67 - 7.46 |
1.3657 times |
Fri 03 October 2025 |
7.45 (-4.49%) |
7.83 |
7.38 - 7.83 |
1.1187 times |
Fri 26 September 2025 |
7.80 (-1.52%) |
7.92 |
7.73 - 8.02 |
1.1744 times |
Fri 19 September 2025 |
7.92 (-0.63%) |
8.05 |
7.82 - 8.23 |
1.3806 times |
Fri 12 September 2025 |
7.97 (-9.64%) |
8.83 |
7.97 - 8.83 |
1.248 times |
Fri 05 September 2025 |
8.82 (2.44%) |
8.51 |
8.42 - 8.90 |
0.7021 times |
Fri 29 August 2025 |
8.61 (0%) |
8.72 |
8.55 - 8.72 |
0.1432 times |
Fri 29 August 2025 |
8.61 (1.65%) |
8.47 |
8.38 - 9.09 |
1.0094 times |
Fri 22 August 2025 |
8.47 (4.96%) |
8.01 |
7.91 - 8.59 |
0.7021 times |
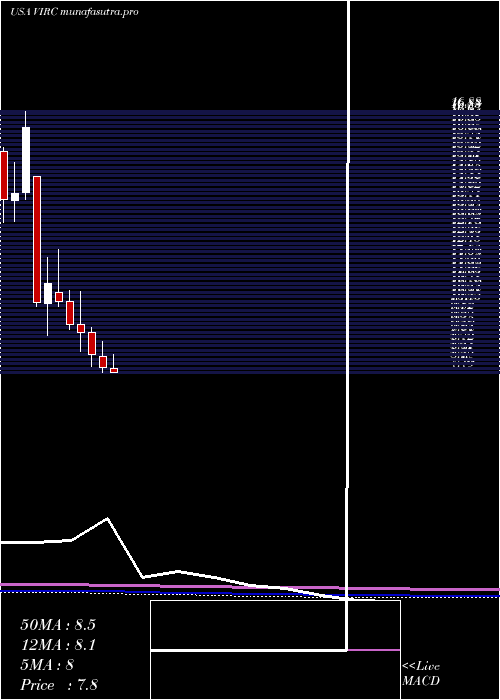
Monthly price and charts VircoManufacturing Strong monthly Stock price targets for VircoManufacturing VIRC are 6.44 and 7.62 | Monthly Target 1 | 6.11 | | Monthly Target 2 | 6.76 | | Monthly Target 3 | 7.2933333333333 | | Monthly Target 4 | 7.94 | | Monthly Target 5 | 8.47 |
Monthly price and volumes Virco Manufacturing
| Date |
Closing |
Open |
Range |
Volume |
Mon 20 October 2025 |
7.40 (-4.52%) |
7.69 |
6.65 - 7.83 |
0.7061 times |
Tue 30 September 2025 |
7.75 (-9.99%) |
8.51 |
7.61 - 8.90 |
0.8814 times |
Fri 29 August 2025 |
8.61 (11.24%) |
7.62 |
7.55 - 9.09 |
0.6357 times |
Thu 31 July 2025 |
7.74 (-3.01%) |
7.93 |
7.47 - 8.52 |
1.0059 times |
Mon 30 June 2025 |
7.98 (-5.11%) |
8.37 |
7.79 - 8.88 |
0.9624 times |
Fri 30 May 2025 |
8.41 (-8.49%) |
9.19 |
8.00 - 9.36 |
0.9187 times |
Wed 30 April 2025 |
9.19 (-2.85%) |
9.46 |
8.52 - 10.62 |
1.1835 times |
Mon 31 March 2025 |
9.46 (-7.98%) |
10.28 |
9.28 - 10.64 |
0.7897 times |
Fri 28 February 2025 |
10.28 (-5.69%) |
10.57 |
10.11 - 12.09 |
1.2427 times |
Fri 31 January 2025 |
10.90 (6.34%) |
10.21 |
9.08 - 11.81 |
1.6737 times |
Tue 31 December 2024 |
10.25 (-37.27%) |
14.62 |
10.09 - 14.62 |
2.474 times |
DMA SMA EMA moving averages of Virco Manufacturing VIRC
DMA (daily moving average) of Virco Manufacturing VIRC
| DMA period | DMA value | | 5 day DMA | 7.15 | | 12 day DMA | 7.06 | | 20 day DMA | 7.32 | | 35 day DMA | 7.7 | | 50 day DMA | 7.91 | | 100 day DMA | 8.02 | | 150 day DMA | 8.45 | | 200 day DMA | 8.98 | EMA (exponential moving average) of Virco Manufacturing VIRC
| EMA period | EMA current | EMA prev | EMA prev2 | | 5 day EMA | 7.19 | 7.09 | 6.98 | | 12 day EMA | 7.18 | 7.14 | 7.11 | | 20 day EMA | 7.33 | 7.32 | 7.32 | | 35 day EMA | 7.56 | 7.57 | 7.59 | | 50 day EMA | 7.85 | 7.87 | 7.89 |
SMA (simple moving average) of Virco Manufacturing VIRC
| SMA period | SMA current | SMA prev | SMA prev2 | | 5 day SMA | 7.15 | 7.02 | 6.9 | | 12 day SMA | 7.06 | 7.06 | 7.08 | | 20 day SMA | 7.32 | 7.34 | 7.38 | | 35 day SMA | 7.7 | 7.73 | 7.77 | | 50 day SMA | 7.91 | 7.92 | 7.94 | | 100 day SMA | 8.02 | 8.03 | 8.04 | | 150 day SMA | 8.45 | 8.47 | 8.48 | | 200 day SMA | 8.98 | 8.99 | 9.01 |
|
|
