VanguardInternational VIGI full analysis,charts,indicators,moving averages,SMA,DMA,EMA,ADX,MACD,RSIVanguard International VIGI WideScreen charts, DMA,SMA,EMA technical analysis, forecast prediction, by indicators ADX,MACD,RSI,CCI USA stock exchange
operates under N A sector & deals in N A
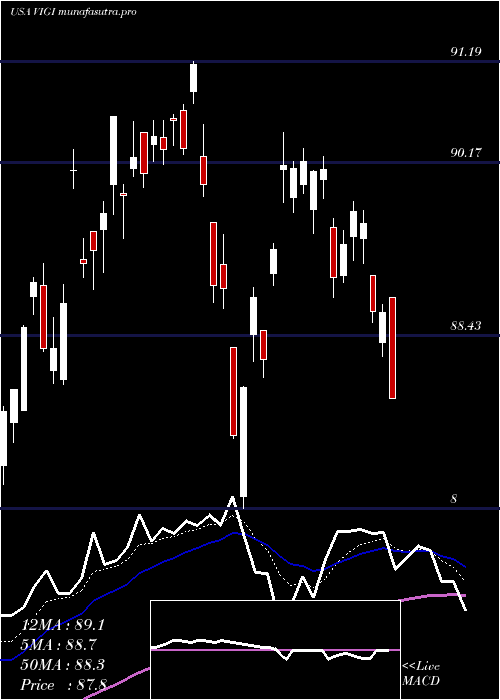
Daily price and charts and targets VanguardInternational Strong Daily Stock price targets for VanguardInternational VIGI are 91.26 and 91.67 | Daily Target 1 | 90.94 | | Daily Target 2 | 91.17 | | Daily Target 3 | 91.346666666667 | | Daily Target 4 | 91.58 | | Daily Target 5 | 91.76 |
Daily price and volume Vanguard International
| Date |
Closing |
Open |
Range |
Volume |
Mon 20 October 2025 |
91.41 (0.84%) |
91.11 |
91.11 - 91.52 |
0.7218 times |
Fri 17 October 2025 |
90.65 (0.31%) |
90.13 |
90.03 - 90.73 |
0.7467 times |
Thu 16 October 2025 |
90.37 (0.47%) |
90.62 |
90.14 - 90.84 |
0.9464 times |
Wed 15 October 2025 |
89.95 (0.6%) |
89.74 |
89.43 - 90.10 |
0.6188 times |
Tue 14 October 2025 |
89.41 (0.25%) |
88.68 |
88.63 - 89.63 |
0.7629 times |
Mon 13 October 2025 |
89.19 (0.84%) |
88.88 |
88.65 - 89.32 |
0.7609 times |
Fri 10 October 2025 |
88.45 (-1.98%) |
89.93 |
88.39 - 89.95 |
3.138 times |
Thu 09 October 2025 |
90.24 (-0.58%) |
90.87 |
90.06 - 90.87 |
0.7195 times |
Wed 08 October 2025 |
90.77 (0.17%) |
91.00 |
90.60 - 91.00 |
0.9128 times |
Tue 07 October 2025 |
90.62 (-0.84%) |
90.97 |
90.57 - 91.00 |
0.6722 times |
Mon 06 October 2025 |
91.39 (0.2%) |
91.61 |
91.28 - 91.61 |
0.6132 times |
Weekly price and charts VanguardInternational Strong weekly Stock price targets for VanguardInternational VIGI are 91.26 and 91.67 | Weekly Target 1 | 90.94 | | Weekly Target 2 | 91.17 | | Weekly Target 3 | 91.346666666667 | | Weekly Target 4 | 91.58 | | Weekly Target 5 | 91.76 |
Weekly price and volumes for Vanguard International
| Date |
Closing |
Open |
Range |
Volume |
Mon 20 October 2025 |
91.41 (0.84%) |
91.11 |
91.11 - 91.52 |
0.1756 times |
Fri 17 October 2025 |
90.65 (2.49%) |
88.88 |
88.63 - 90.84 |
0.9332 times |
Fri 10 October 2025 |
88.45 (-3.03%) |
91.61 |
88.39 - 91.61 |
1.4733 times |
Fri 03 October 2025 |
91.21 (3%) |
88.81 |
88.76 - 91.31 |
0.9467 times |
Fri 26 September 2025 |
88.55 (-1.49%) |
89.77 |
87.90 - 90.34 |
0.9971 times |
Fri 19 September 2025 |
89.89 (-0.14%) |
90.19 |
89.72 - 90.90 |
3.3036 times |
Fri 12 September 2025 |
90.02 (0.35%) |
90.28 |
89.79 - 90.58 |
0.7325 times |
Fri 05 September 2025 |
89.71 (0.5%) |
88.44 |
88.25 - 90.25 |
0.6175 times |
Fri 29 August 2025 |
89.26 (0%) |
89.16 |
89.04 - 89.40 |
0.1231 times |
Fri 29 August 2025 |
89.26 (-1.39%) |
90.06 |
88.97 - 90.23 |
0.6974 times |
Fri 22 August 2025 |
90.52 (1.07%) |
89.41 |
89.21 - 90.68 |
0.7008 times |
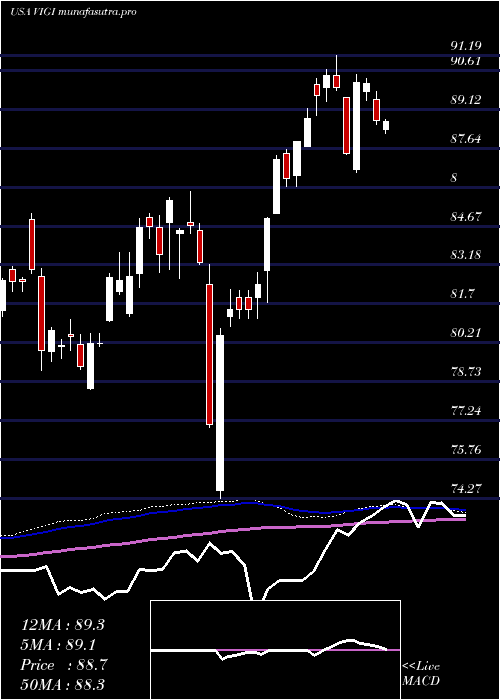
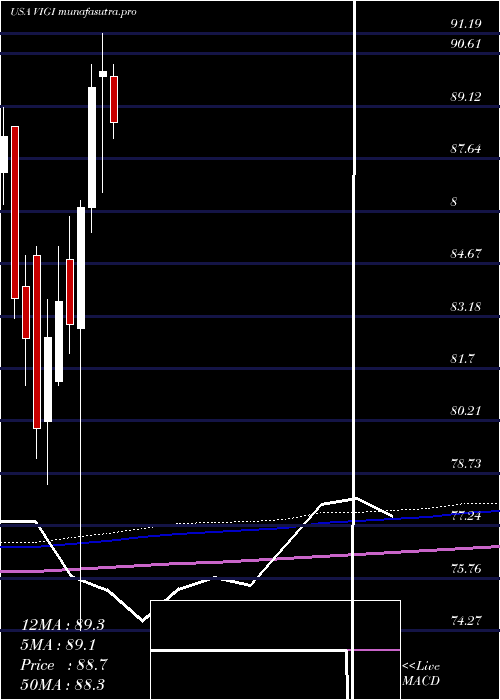
Monthly price and charts VanguardInternational Strong monthly Stock price targets for VanguardInternational VIGI are 89.9 and 93.12 | Monthly Target 1 | 87.25 | | Monthly Target 2 | 89.33 | | Monthly Target 3 | 90.47 | | Monthly Target 4 | 92.55 | | Monthly Target 5 | 93.69 |
Monthly price and volumes Vanguard International
| Date |
Closing |
Open |
Range |
Volume |
Mon 20 October 2025 |
91.41 (2.05%) |
90.00 |
88.39 - 91.61 |
0.7131 times |
Tue 30 September 2025 |
89.57 (0.35%) |
88.44 |
87.90 - 90.90 |
1.4168 times |
Fri 29 August 2025 |
89.26 (3.55%) |
85.97 |
85.53 - 90.68 |
0.7173 times |
Thu 31 July 2025 |
86.20 (-4.35%) |
89.96 |
86.05 - 90.74 |
1.0216 times |
Mon 30 June 2025 |
90.12 (0.51%) |
89.96 |
86.70 - 91.19 |
0.9451 times |
Fri 30 May 2025 |
89.66 (3.94%) |
86.27 |
85.54 - 90.30 |
1.0649 times |
Wed 30 April 2025 |
86.26 (4%) |
82.82 |
74.27 - 86.46 |
1.0732 times |
Mon 31 March 2025 |
82.94 (-0.78%) |
84.80 |
82.13 - 86.00 |
1.017 times |
Fri 28 February 2025 |
83.59 (1.24%) |
81.34 |
81.23 - 85.15 |
0.9344 times |
Fri 31 January 2025 |
82.57 (3.23%) |
80.18 |
78.41 - 83.66 |
1.0966 times |
Tue 31 December 2024 |
79.99 (-3.09%) |
84.91 |
79.14 - 85.15 |
0.6822 times |
DMA SMA EMA moving averages of Vanguard International VIGI
DMA (daily moving average) of Vanguard International VIGI
| DMA period | DMA value | | 5 day DMA | 90.36 | | 12 day DMA | 90.31 | | 20 day DMA | 89.9 | | 35 day DMA | 89.91 | | 50 day DMA | 89.77 | | 100 day DMA | 89.41 | | 150 day DMA | 87.72 | | 200 day DMA | 86.45 | EMA (exponential moving average) of Vanguard International VIGI
| EMA period | EMA current | EMA prev | EMA prev2 | | 5 day EMA | 90.58 | 90.16 | 89.91 | | 12 day EMA | 90.23 | 90.02 | 89.9 | | 20 day EMA | 90.08 | 89.94 | 89.87 | | 35 day EMA | 89.84 | 89.75 | 89.7 | | 50 day EMA | 89.67 | 89.6 | 89.56 |
SMA (simple moving average) of Vanguard International VIGI
| SMA period | SMA current | SMA prev | SMA prev2 | | 5 day SMA | 90.36 | 89.91 | 89.47 | | 12 day SMA | 90.31 | 90.21 | 90.17 | | 20 day SMA | 89.9 | 89.83 | 89.79 | | 35 day SMA | 89.91 | 89.85 | 89.81 | | 50 day SMA | 89.77 | 89.71 | 89.66 | | 100 day SMA | 89.41 | 89.4 | 89.38 | | 150 day SMA | 87.72 | 87.67 | 87.62 | | 200 day SMA | 86.45 | 86.4 | 86.34 |
|
|
