VicorCorporation VICR full analysis,charts,indicators,moving averages,SMA,DMA,EMA,ADX,MACD,RSIVicor Corporation VICR WideScreen charts, DMA,SMA,EMA technical analysis, forecast prediction, by indicators ADX,MACD,RSI,CCI USA stock exchange
operates under Capital Goods sector & deals in Industrial Machinery Components
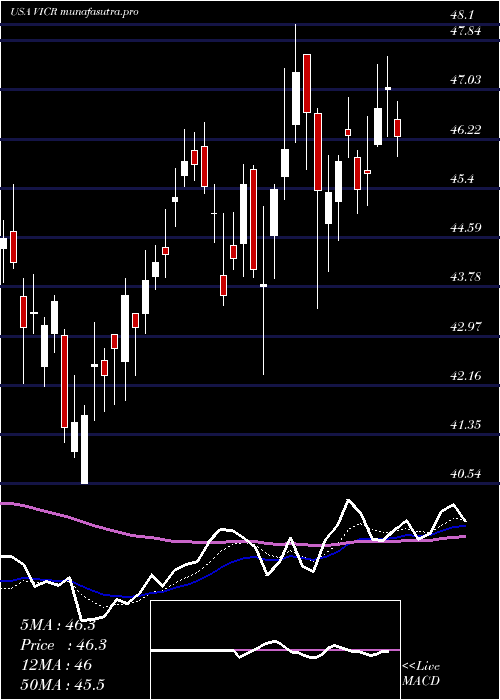
Daily price and charts and targets VicorCorporation Strong Daily Stock price targets for VicorCorporation VICR are 55.69 and 59.99 | Daily Target 1 | 54.88 | | Daily Target 2 | 56.5 | | Daily Target 3 | 59.176666666667 | | Daily Target 4 | 60.8 | | Daily Target 5 | 63.48 |
Daily price and volume Vicor Corporation
| Date |
Closing |
Open |
Range |
Volume |
Mon 20 October 2025 |
58.13 (1.22%) |
58.56 |
57.55 - 61.85 |
0.6271 times |
Fri 17 October 2025 |
57.43 (-5.03%) |
59.35 |
57.00 - 60.96 |
1.4692 times |
Thu 16 October 2025 |
60.47 (5.51%) |
58.00 |
57.96 - 61.40 |
1.885 times |
Wed 15 October 2025 |
57.31 (6.82%) |
54.59 |
54.07 - 57.32 |
1.2885 times |
Tue 14 October 2025 |
53.65 (3.25%) |
50.82 |
50.31 - 54.11 |
0.8967 times |
Mon 13 October 2025 |
51.96 (7%) |
50.10 |
49.83 - 52.50 |
0.8086 times |
Fri 10 October 2025 |
48.56 (-7.72%) |
52.67 |
48.53 - 53.17 |
0.8133 times |
Thu 09 October 2025 |
52.62 (2.17%) |
51.82 |
50.52 - 52.94 |
0.615 times |
Wed 08 October 2025 |
51.50 (5.9%) |
48.86 |
48.79 - 51.58 |
0.83 times |
Tue 07 October 2025 |
48.63 (-2.68%) |
50.45 |
48.55 - 51.16 |
0.7667 times |
Mon 06 October 2025 |
49.97 (1.92%) |
49.96 |
49.39 - 50.62 |
0.9537 times |
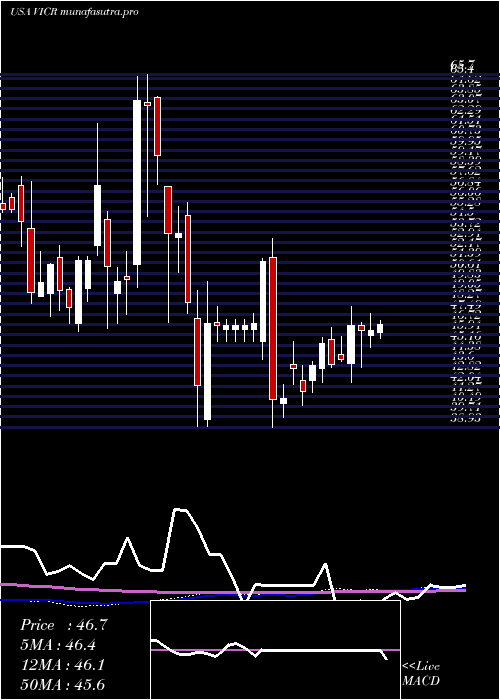
Weekly price and charts VicorCorporation Strong weekly Stock price targets for VicorCorporation VICR are 55.69 and 59.99 | Weekly Target 1 | 54.88 | | Weekly Target 2 | 56.5 | | Weekly Target 3 | 59.176666666667 | | Weekly Target 4 | 60.8 | | Weekly Target 5 | 63.48 |
Weekly price and volumes for Vicor Corporation
| Date |
Closing |
Open |
Range |
Volume |
Mon 20 October 2025 |
58.13 (1.22%) |
58.56 |
57.55 - 61.85 |
0.1583 times |
Fri 17 October 2025 |
57.43 (18.27%) |
50.10 |
49.83 - 61.40 |
1.6028 times |
Fri 10 October 2025 |
48.56 (-0.96%) |
49.96 |
48.53 - 53.17 |
1.0045 times |
Fri 03 October 2025 |
49.03 (0.74%) |
49.46 |
48.31 - 50.34 |
1.2214 times |
Fri 26 September 2025 |
48.67 (-7.96%) |
52.76 |
47.56 - 55.52 |
1.0305 times |
Fri 19 September 2025 |
52.88 (4.16%) |
51.00 |
50.85 - 54.32 |
1.2582 times |
Fri 12 September 2025 |
50.77 (-1.99%) |
52.00 |
49.36 - 52.37 |
0.9366 times |
Fri 05 September 2025 |
51.80 (1.35%) |
49.53 |
49.14 - 53.12 |
0.8672 times |
Fri 29 August 2025 |
51.11 (0%) |
51.85 |
50.72 - 52.12 |
0.3257 times |
Fri 29 August 2025 |
51.11 (0.31%) |
50.96 |
50.54 - 52.62 |
1.5946 times |
Fri 22 August 2025 |
50.95 (6.93%) |
47.60 |
45.44 - 51.17 |
1.2125 times |
Monthly price and charts VicorCorporation Strong monthly Stock price targets for VicorCorporation VICR are 53.33 and 66.65 | Monthly Target 1 | 42.85 | | Monthly Target 2 | 50.49 | | Monthly Target 3 | 56.17 | | Monthly Target 4 | 63.81 | | Monthly Target 5 | 69.49 |
Monthly price and volumes Vicor Corporation
| Date |
Closing |
Open |
Range |
Volume |
Mon 20 October 2025 |
58.13 (16.91%) |
49.12 |
48.53 - 61.85 |
0.7056 times |
Tue 30 September 2025 |
49.72 (-2.72%) |
49.53 |
47.56 - 55.52 |
1.0147 times |
Fri 29 August 2025 |
51.11 (15.01%) |
42.56 |
41.76 - 52.62 |
1.4152 times |
Thu 31 July 2025 |
44.44 (-2.03%) |
44.83 |
43.68 - 63.00 |
1.4157 times |
Mon 30 June 2025 |
45.36 (3.94%) |
43.35 |
42.33 - 48.10 |
0.7985 times |
Fri 30 May 2025 |
43.64 (9.35%) |
39.70 |
39.32 - 45.46 |
0.8682 times |
Wed 30 April 2025 |
39.91 (-14.69%) |
46.63 |
38.93 - 53.23 |
0.9533 times |
Mon 31 March 2025 |
46.78 (-26.13%) |
63.93 |
45.45 - 63.99 |
0.9076 times |
Fri 28 February 2025 |
63.33 (23.84%) |
49.07 |
46.81 - 65.70 |
1.0483 times |
Fri 31 January 2025 |
51.14 (5.84%) |
48.72 |
46.17 - 62.00 |
0.8729 times |
Tue 31 December 2024 |
48.32 (-12.84%) |
57.28 |
48.05 - 57.98 |
0.5864 times |

DMA SMA EMA moving averages of Vicor Corporation VICR
DMA (daily moving average) of Vicor Corporation VICR
| DMA period | DMA value | | 5 day DMA | 57.4 | | 12 day DMA | 53.27 | | 20 day DMA | 52.15 | | 35 day DMA | 51.94 | | 50 day DMA | 51.16 | | 100 day DMA | 48.44 | | 150 day DMA | 47.63 | | 200 day DMA | 48.99 | EMA (exponential moving average) of Vicor Corporation VICR
| EMA period | EMA current | EMA prev | EMA prev2 | | 5 day EMA | 56.97 | 56.39 | 55.87 | | 12 day EMA | 54.58 | 53.93 | 53.29 | | 20 day EMA | 53.33 | 52.82 | 52.33 | | 35 day EMA | 51.98 | 51.62 | 51.28 | | 50 day EMA | 51.4 | 51.13 | 50.87 |
SMA (simple moving average) of Vicor Corporation VICR
| SMA period | SMA current | SMA prev | SMA prev2 | | 5 day SMA | 57.4 | 56.16 | 54.39 | | 12 day SMA | 53.27 | 52.5 | 51.82 | | 20 day SMA | 52.15 | 51.98 | 51.76 | | 35 day SMA | 51.94 | 51.74 | 51.56 | | 50 day SMA | 51.16 | 50.92 | 50.71 | | 100 day SMA | 48.44 | 48.28 | 48.12 | | 150 day SMA | 47.63 | 47.6 | 47.56 | | 200 day SMA | 48.99 | 48.94 | 48.9 |
|
|
