VanguardLong VGLT full analysis,charts,indicators,moving averages,SMA,DMA,EMA,ADX,MACD,RSIVanguard Long VGLT WideScreen charts, DMA,SMA,EMA technical analysis, forecast prediction, by indicators ADX,MACD,RSI,CCI USA stock exchange
operates under N A sector & deals in N A
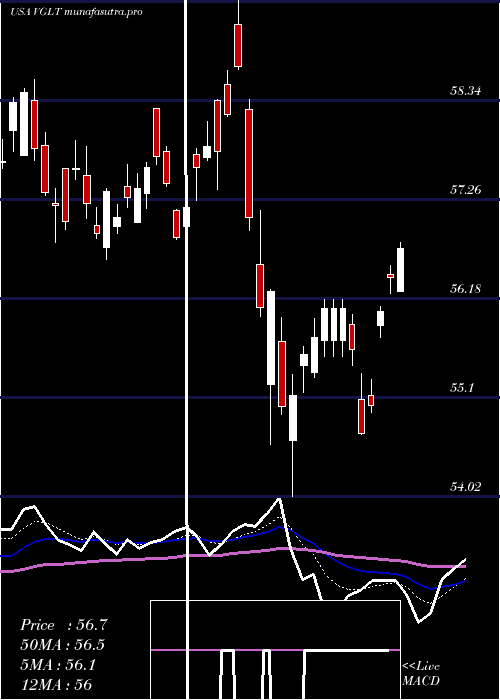
Daily price and charts and targets VanguardLong Strong Daily Stock price targets for VanguardLong VGLT are 58.27 and 58.42 | Daily Target 1 | 58.21 | | Daily Target 2 | 58.27 | | Daily Target 3 | 58.356666666667 | | Daily Target 4 | 58.42 | | Daily Target 5 | 58.51 |
Daily price and volume Vanguard Long
| Date |
Closing |
Open |
Range |
Volume |
Tue 21 October 2025 |
58.34 (0.45%) |
58.34 |
58.29 - 58.44 |
0.8076 times |
Mon 20 October 2025 |
58.08 (0.38%) |
57.70 |
57.70 - 58.25 |
0.5888 times |
Fri 17 October 2025 |
57.86 (-0.22%) |
57.92 |
57.71 - 57.93 |
1.1635 times |
Thu 16 October 2025 |
57.99 (0.73%) |
57.50 |
57.47 - 58.06 |
1.0915 times |
Wed 15 October 2025 |
57.57 (-0.23%) |
57.75 |
57.47 - 57.95 |
1.3771 times |
Tue 14 October 2025 |
57.70 (0.35%) |
57.58 |
57.46 - 57.73 |
1.2849 times |
Mon 13 October 2025 |
57.50 (-0.05%) |
57.35 |
57.11 - 57.52 |
0.8621 times |
Fri 10 October 2025 |
57.53 (1.41%) |
57.21 |
57.15 - 57.61 |
1.1603 times |
Thu 09 October 2025 |
56.73 (-0.09%) |
56.73 |
56.64 - 56.80 |
0.6844 times |
Wed 08 October 2025 |
56.78 (0.07%) |
56.99 |
56.71 - 57.00 |
0.9797 times |
Tue 07 October 2025 |
56.74 (0.53%) |
56.61 |
56.54 - 56.87 |
0.8646 times |
Weekly price and charts VanguardLong Strong weekly Stock price targets for VanguardLong VGLT are 58.02 and 58.76 | Weekly Target 1 | 57.42 | | Weekly Target 2 | 57.88 | | Weekly Target 3 | 58.16 | | Weekly Target 4 | 58.62 | | Weekly Target 5 | 58.9 |
Weekly price and volumes for Vanguard Long
| Date |
Closing |
Open |
Range |
Volume |
Tue 21 October 2025 |
58.34 (0.83%) |
57.70 |
57.70 - 58.44 |
0.2579 times |
Fri 17 October 2025 |
57.86 (0.57%) |
57.35 |
57.11 - 58.06 |
1.0672 times |
Fri 10 October 2025 |
57.53 (1.32%) |
56.48 |
56.43 - 57.61 |
0.8937 times |
Fri 03 October 2025 |
56.78 (0.39%) |
56.80 |
56.69 - 57.22 |
1.0549 times |
Fri 26 September 2025 |
56.56 (-0.21%) |
56.57 |
56.34 - 56.89 |
0.8695 times |
Fri 19 September 2025 |
56.68 (-0.87%) |
57.32 |
56.54 - 57.84 |
1.2494 times |
Fri 12 September 2025 |
57.18 (1.29%) |
56.81 |
56.70 - 57.53 |
1.3022 times |
Fri 05 September 2025 |
56.45 (1.91%) |
54.78 |
54.70 - 56.50 |
1.3604 times |
Fri 29 August 2025 |
55.39 (0%) |
55.44 |
55.26 - 55.49 |
0.5638 times |
Fri 29 August 2025 |
55.39 (-0.25%) |
55.36 |
54.99 - 55.71 |
1.3812 times |
Fri 22 August 2025 |
55.53 (0.71%) |
55.18 |
54.89 - 55.68 |
1.0069 times |
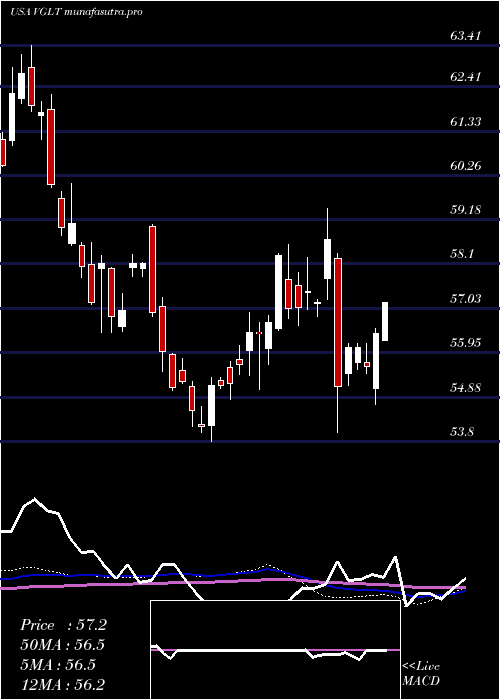
Monthly price and charts VanguardLong Strong monthly Stock price targets for VanguardLong VGLT are 57.39 and 59.4 | Monthly Target 1 | 55.73 | | Monthly Target 2 | 57.03 | | Monthly Target 3 | 57.736666666667 | | Monthly Target 4 | 59.04 | | Monthly Target 5 | 59.75 |
Monthly price and volumes Vanguard Long
| Date |
Closing |
Open |
Range |
Volume |
Tue 21 October 2025 |
58.34 (2.6%) |
56.90 |
56.43 - 58.44 |
0.5302 times |
Tue 30 September 2025 |
56.86 (2.65%) |
54.78 |
54.70 - 57.84 |
0.9541 times |
Fri 29 August 2025 |
55.39 (-0.04%) |
55.75 |
54.89 - 56.30 |
0.9529 times |
Thu 31 July 2025 |
55.41 (-1.27%) |
56.01 |
53.77 - 56.13 |
0.9835 times |
Mon 30 June 2025 |
56.12 (2.09%) |
54.35 |
54.07 - 56.22 |
0.7951 times |
Fri 30 May 2025 |
54.97 (-3.29%) |
56.64 |
53.18 - 56.70 |
1.203 times |
Wed 30 April 2025 |
56.84 (-1.34%) |
57.72 |
54.02 - 59.46 |
1.5747 times |
Mon 31 March 2025 |
57.61 (-1.22%) |
57.74 |
56.61 - 58.57 |
0.9269 times |
Fri 28 February 2025 |
58.32 (4.76%) |
56.01 |
55.05 - 58.37 |
0.9113 times |
Fri 31 January 2025 |
55.67 (0.58%) |
55.55 |
53.80 - 56.13 |
1.1682 times |
Tue 31 December 2024 |
55.35 (-4.77%) |
59.02 |
55.03 - 59.06 |
1.1427 times |

DMA SMA EMA moving averages of Vanguard Long VGLT
DMA (daily moving average) of Vanguard Long VGLT
| DMA period | DMA value | | 5 day DMA | 57.97 | | 12 day DMA | 57.44 | | 20 day DMA | 57.18 | | 35 day DMA | 57.01 | | 50 day DMA | 56.52 | | 100 day DMA | 55.83 | | 150 day DMA | 55.88 | | 200 day DMA | 55.92 | EMA (exponential moving average) of Vanguard Long VGLT
| EMA period | EMA current | EMA prev | EMA prev2 | | 5 day EMA | 57.99 | 57.82 | 57.69 | | 12 day EMA | 57.62 | 57.49 | 57.38 | | 20 day EMA | 57.35 | 57.25 | 57.16 | | 35 day EMA | 56.92 | 56.84 | 56.77 | | 50 day EMA | 56.59 | 56.52 | 56.46 |
SMA (simple moving average) of Vanguard Long VGLT
| SMA period | SMA current | SMA prev | SMA prev2 | | 5 day SMA | 57.97 | 57.84 | 57.72 | | 12 day SMA | 57.44 | 57.31 | 57.22 | | 20 day SMA | 57.18 | 57.1 | 57.03 | | 35 day SMA | 57.01 | 56.91 | 56.84 | | 50 day SMA | 56.52 | 56.46 | 56.41 | | 100 day SMA | 55.83 | 55.79 | 55.75 | | 150 day SMA | 55.88 | 55.87 | 55.86 | | 200 day SMA | 55.92 | 55.91 | 55.9 |
|
|
