VF VFC full analysis,charts,indicators,moving averages,SMA,DMA,EMA,ADX,MACD,RSIV F VFC WideScreen charts, DMA,SMA,EMA technical analysis, forecast prediction, by indicators ADX,MACD,RSI,CCI USA stock exchange
operates under Consumer Non Durables sector & deals in Apparel
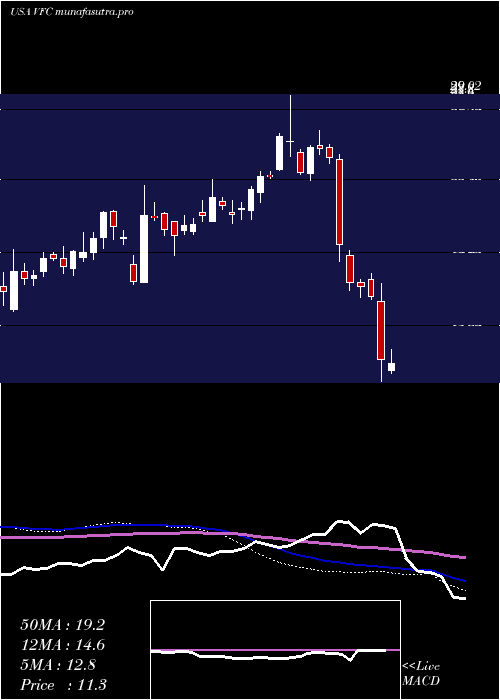
Daily price and charts and targets VF Strong Daily Stock price targets for VF VFC are 18.82 and 19.5 | Daily Target 1 | 18.29 | | Daily Target 2 | 18.67 | | Daily Target 3 | 18.97 | | Daily Target 4 | 19.35 | | Daily Target 5 | 19.65 |
Daily price and volume V F
| Date |
Closing |
Open |
Range |
Volume |
Fri 05 December 2025 |
19.05 (2.58%) |
18.60 |
18.59 - 19.27 |
0.8904 times |
Thu 04 December 2025 |
18.57 (-0.54%) |
18.56 |
18.26 - 18.78 |
0.7176 times |
Wed 03 December 2025 |
18.67 (5.36%) |
17.80 |
17.73 - 18.77 |
1.0114 times |
Tue 02 December 2025 |
17.72 (-2.32%) |
18.23 |
17.64 - 18.23 |
0.9331 times |
Mon 01 December 2025 |
18.14 (3.66%) |
17.27 |
16.98 - 18.24 |
0.906 times |
Fri 28 November 2025 |
17.50 (1.33%) |
17.24 |
17.11 - 17.69 |
0.3412 times |
Wed 26 November 2025 |
17.27 (0.17%) |
17.18 |
17.17 - 17.60 |
0.9412 times |
Tue 25 November 2025 |
17.24 (5.31%) |
16.57 |
16.37 - 17.56 |
1.3622 times |
Mon 24 November 2025 |
16.37 (0.99%) |
16.16 |
15.96 - 16.58 |
1.3256 times |
Fri 21 November 2025 |
16.21 (10.8%) |
14.85 |
14.83 - 16.29 |
1.5713 times |
Thu 20 November 2025 |
14.63 (-0.27%) |
14.86 |
14.62 - 15.36 |
0.9272 times |

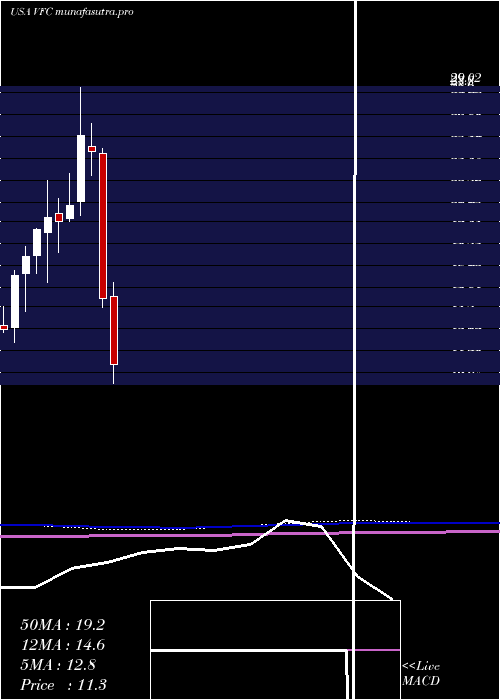
Weekly price and charts VF Strong weekly Stock price targets for VF VFC are 18.02 and 20.31 | Weekly Target 1 | 16.14 | | Weekly Target 2 | 17.6 | | Weekly Target 3 | 18.433333333333 | | Weekly Target 4 | 19.89 | | Weekly Target 5 | 20.72 |
Weekly price and volumes for V F
| Date |
Closing |
Open |
Range |
Volume |
Fri 05 December 2025 |
19.05 (8.86%) |
17.27 |
16.98 - 19.27 |
0.9593 times |
Fri 28 November 2025 |
17.50 (7.96%) |
16.16 |
15.96 - 17.69 |
0.8542 times |
Fri 21 November 2025 |
16.21 (8.28%) |
14.89 |
14.08 - 16.29 |
1.0329 times |
Fri 14 November 2025 |
14.97 (2.18%) |
15.00 |
14.40 - 15.73 |
0.7017 times |
Fri 07 November 2025 |
14.65 (4.34%) |
13.93 |
13.56 - 15.06 |
0.7156 times |
Fri 31 October 2025 |
14.04 (0%) |
13.92 |
13.64 - 14.10 |
0.2595 times |
Fri 31 October 2025 |
14.04 (-14.02%) |
16.50 |
13.64 - 16.94 |
2.145 times |
Fri 24 October 2025 |
16.33 (14.36%) |
14.35 |
14.11 - 16.43 |
1.0006 times |
Fri 17 October 2025 |
14.28 (7.45%) |
13.61 |
13.55 - 14.84 |
1.0686 times |
Fri 10 October 2025 |
13.29 (-12.51%) |
15.25 |
13.02 - 15.56 |
1.2626 times |
Fri 03 October 2025 |
15.19 (3.12%) |
14.83 |
14.08 - 15.59 |
0.9559 times |
Monthly price and charts VF Strong monthly Stock price targets for VF VFC are 18.02 and 20.31 | Monthly Target 1 | 16.14 | | Monthly Target 2 | 17.6 | | Monthly Target 3 | 18.433333333333 | | Monthly Target 4 | 19.89 | | Monthly Target 5 | 20.72 |
Monthly price and volumes V F
| Date |
Closing |
Open |
Range |
Volume |
Fri 05 December 2025 |
19.05 (8.86%) |
17.27 |
16.98 - 19.27 |
0.1677 times |
Fri 28 November 2025 |
17.50 (24.64%) |
13.93 |
13.56 - 17.69 |
0.5776 times |
Fri 31 October 2025 |
14.04 (-2.7%) |
14.49 |
13.02 - 16.94 |
1.0989 times |
Tue 30 September 2025 |
14.43 (-4.63%) |
14.78 |
13.84 - 15.65 |
0.9659 times |
Fri 29 August 2025 |
15.13 (29.1%) |
11.52 |
11.10 - 15.57 |
1.0687 times |
Thu 31 July 2025 |
11.72 (-0.26%) |
11.61 |
11.45 - 15.40 |
1.2186 times |
Mon 30 June 2025 |
11.75 (-5.7%) |
12.39 |
11.06 - 13.34 |
0.796 times |
Fri 30 May 2025 |
12.46 (4.88%) |
12.01 |
11.54 - 15.49 |
1.1911 times |
Wed 30 April 2025 |
11.88 (-23.45%) |
15.64 |
9.41 - 16.56 |
1.622 times |
Mon 31 March 2025 |
15.52 (-37.75%) |
24.77 |
14.93 - 25.09 |
1.2934 times |
Fri 28 February 2025 |
24.93 (-4%) |
25.24 |
23.41 - 26.69 |
0.5069 times |
DMA SMA EMA moving averages of V F VFC
DMA (daily moving average) of V F VFC
| DMA period | DMA value | | 5 day DMA | 18.43 | | 12 day DMA | 17.17 | | 20 day DMA | 16.23 | | 35 day DMA | 15.62 | | 50 day DMA | 15.27 | | 100 day DMA | 14.47 | | 150 day DMA | 13.87 | | 200 day DMA | 14.38 | EMA (exponential moving average) of V F VFC
| EMA period | EMA current | EMA prev | EMA prev2 | | 5 day EMA | 18.4 | 18.08 | 17.84 | | 12 day EMA | 17.43 | 17.14 | 16.88 | | 20 day EMA | 16.73 | 16.49 | 16.27 | | 35 day EMA | 16.05 | 15.87 | 15.71 | | 50 day EMA | 15.53 | 15.39 | 15.26 |
SMA (simple moving average) of V F VFC
| SMA period | SMA current | SMA prev | SMA prev2 | | 5 day SMA | 18.43 | 18.12 | 17.86 | | 12 day SMA | 17.17 | 16.8 | 16.44 | | 20 day SMA | 16.23 | 15.99 | 15.8 | | 35 day SMA | 15.62 | 15.48 | 15.36 | | 50 day SMA | 15.27 | 15.18 | 15.1 | | 100 day SMA | 14.47 | 14.39 | 14.33 | | 150 day SMA | 13.87 | 13.83 | 13.78 | | 200 day SMA | 14.38 | 14.42 | 14.45 |
|
|
