Veon VEON full analysis,charts,indicators,moving averages,SMA,DMA,EMA,ADX,MACD,RSIVeon VEON WideScreen charts, DMA,SMA,EMA technical analysis, forecast prediction, by indicators ADX,MACD,RSI,CCI USA stock exchange
operates under Public Utilities sector & deals in Telecommunications Equipment
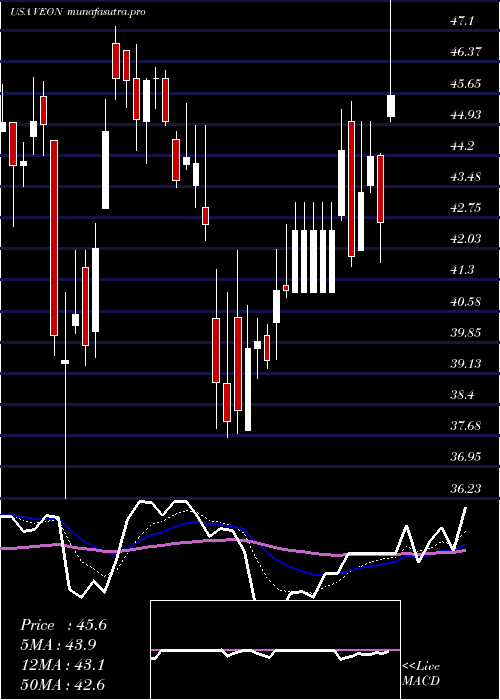
Daily price and charts and targets Veon Strong Daily Stock price targets for Veon VEON are 49.75 and 51.58 | Daily Target 1 | 48.31 | | Daily Target 2 | 49.35 | | Daily Target 3 | 50.14 | | Daily Target 4 | 51.18 | | Daily Target 5 | 51.97 |
Daily price and volume Veon
| Date |
Closing |
Open |
Range |
Volume |
Thu 04 December 2025 |
50.39 (2.48%) |
49.10 |
49.10 - 50.93 |
0.5664 times |
Wed 03 December 2025 |
49.17 (-5.42%) |
51.30 |
48.68 - 51.42 |
0.7151 times |
Tue 02 December 2025 |
51.99 (0%) |
51.99 |
51.86 - 53.00 |
0.4563 times |
Mon 01 December 2025 |
51.99 (-2.62%) |
53.00 |
51.38 - 53.00 |
1.6497 times |
Fri 28 November 2025 |
53.39 (0.34%) |
53.30 |
53.10 - 54.66 |
0.3461 times |
Wed 26 November 2025 |
53.21 (-0.32%) |
53.56 |
52.77 - 54.04 |
0.5242 times |
Tue 25 November 2025 |
53.38 (2.67%) |
53.95 |
52.86 - 55.55 |
2.0711 times |
Mon 24 November 2025 |
51.99 (-1.03%) |
52.34 |
51.55 - 53.59 |
0.9823 times |
Fri 21 November 2025 |
52.53 (1.96%) |
50.58 |
50.58 - 52.79 |
1.0374 times |
Thu 20 November 2025 |
51.52 (-0.96%) |
51.00 |
50.45 - 52.50 |
1.6515 times |
Wed 19 November 2025 |
52.02 (4.71%) |
50.42 |
49.55 - 52.66 |
1.9976 times |
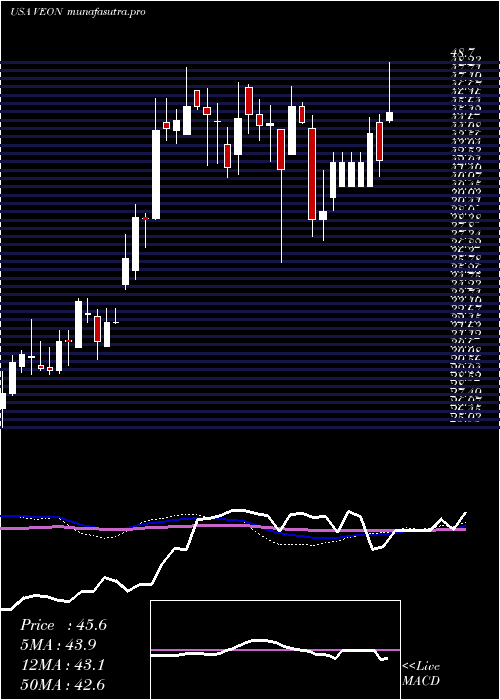
Weekly price and charts Veon Strong weekly Stock price targets for Veon VEON are 47.38 and 51.7 | Weekly Target 1 | 46.37 | | Weekly Target 2 | 48.38 | | Weekly Target 3 | 50.69 | | Weekly Target 4 | 52.7 | | Weekly Target 5 | 55.01 |
Weekly price and volumes for Veon
| Date |
Closing |
Open |
Range |
Volume |
Thu 04 December 2025 |
50.39 (-5.62%) |
53.00 |
48.68 - 53.00 |
0.7908 times |
Fri 28 November 2025 |
53.39 (1.64%) |
52.34 |
51.55 - 55.55 |
0.9159 times |
Fri 21 November 2025 |
52.53 (9.1%) |
48.37 |
47.08 - 52.79 |
1.5374 times |
Fri 14 November 2025 |
48.15 (10.54%) |
49.18 |
46.44 - 51.50 |
1.4605 times |
Fri 07 November 2025 |
43.56 (-9.53%) |
47.34 |
42.60 - 47.81 |
1.0644 times |
Fri 31 October 2025 |
48.15 (0%) |
47.50 |
47.50 - 48.98 |
0.1179 times |
Fri 31 October 2025 |
48.15 (-4.67%) |
50.52 |
46.25 - 50.77 |
1.0359 times |
Fri 24 October 2025 |
50.51 (-2.75%) |
52.23 |
49.90 - 53.70 |
0.8143 times |
Fri 17 October 2025 |
51.94 (3.18%) |
50.26 |
48.71 - 55.43 |
1.2982 times |
Fri 10 October 2025 |
50.34 (-3.58%) |
53.44 |
49.20 - 53.44 |
0.9647 times |
Fri 03 October 2025 |
52.21 (-0.74%) |
52.58 |
51.10 - 54.43 |
1.0348 times |
Monthly price and charts Veon Strong monthly Stock price targets for Veon VEON are 47.38 and 51.7 | Monthly Target 1 | 46.37 | | Monthly Target 2 | 48.38 | | Monthly Target 3 | 50.69 | | Monthly Target 4 | 52.7 | | Monthly Target 5 | 55.01 |
Monthly price and volumes Veon
| Date |
Closing |
Open |
Range |
Volume |
Thu 04 December 2025 |
50.39 (-5.62%) |
53.00 |
48.68 - 53.00 |
0.1129 times |
Fri 28 November 2025 |
53.39 (10.88%) |
47.34 |
42.60 - 55.55 |
0.711 times |
Fri 31 October 2025 |
48.15 (-11.54%) |
53.41 |
46.25 - 55.43 |
0.6696 times |
Tue 30 September 2025 |
54.43 (-7%) |
56.89 |
50.00 - 58.36 |
0.8341 times |
Fri 29 August 2025 |
58.53 (6.98%) |
53.80 |
47.20 - 64.00 |
1.5194 times |
Thu 31 July 2025 |
54.71 (18.75%) |
44.48 |
42.54 - 59.68 |
1.4404 times |
Mon 30 June 2025 |
46.07 (-12.99%) |
53.08 |
34.55 - 54.29 |
1.4714 times |
Fri 30 May 2025 |
52.95 (16.73%) |
46.22 |
43.81 - 58.30 |
1.6603 times |
Wed 30 April 2025 |
45.36 (4.01%) |
44.00 |
37.63 - 48.70 |
0.7722 times |
Mon 31 March 2025 |
43.61 (-2.57%) |
44.76 |
36.23 - 47.21 |
0.8087 times |
Fri 28 February 2025 |
44.76 (-0.64%) |
43.61 |
41.54 - 47.50 |
0.71 times |

DMA SMA EMA moving averages of Veon VEON
DMA (daily moving average) of Veon VEON
| DMA period | DMA value | | 5 day DMA | 51.39 | | 12 day DMA | 51.77 | | 20 day DMA | 50.01 | | 35 day DMA | 49.91 | | 50 day DMA | 50.47 | | 100 day DMA | 52.83 | | 150 day DMA | 51.18 | | 200 day DMA | 49.2 | EMA (exponential moving average) of Veon VEON
| EMA period | EMA current | EMA prev | EMA prev2 | | 5 day EMA | 50.98 | 51.28 | 52.33 | | 12 day EMA | 51.06 | 51.18 | 51.54 | | 20 day EMA | 50.71 | 50.74 | 50.91 | | 35 day EMA | 50.8 | 50.82 | 50.92 | | 50 day EMA | 50.84 | 50.86 | 50.93 |
SMA (simple moving average) of Veon VEON
| SMA period | SMA current | SMA prev | SMA prev2 | | 5 day SMA | 51.39 | 51.95 | 52.79 | | 12 day SMA | 51.77 | 51.62 | 51.53 | | 20 day SMA | 50.01 | 49.8 | 49.62 | | 35 day SMA | 49.91 | 49.94 | 49.93 | | 50 day SMA | 50.47 | 50.53 | 50.64 | | 100 day SMA | 52.83 | 52.86 | 52.91 | | 150 day SMA | 51.18 | 51.15 | 51.12 | | 200 day SMA | 49.2 | 49.18 | 49.16 |
|
|
