VeevaSystems VEEV full analysis,charts,indicators,moving averages,SMA,DMA,EMA,ADX,MACD,RSIVeeva Systems VEEV WideScreen charts, DMA,SMA,EMA technical analysis, forecast prediction, by indicators ADX,MACD,RSI,CCI USA stock exchange
operates under Technology sector & deals in Computer Software Prepackaged Software
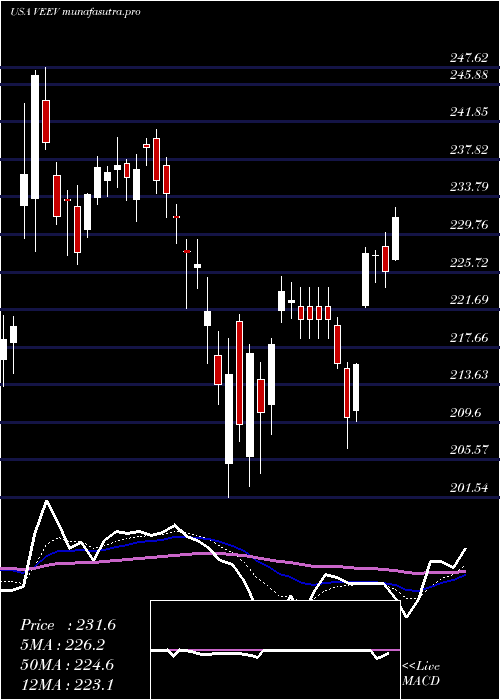
Daily price and charts and targets VeevaSystems Strong Daily Stock price targets for VeevaSystems VEEV are 240.58 and 248.29 | Daily Target 1 | 234.86 | | Daily Target 2 | 238.58 | | Daily Target 3 | 242.57333333333 | | Daily Target 4 | 246.29 | | Daily Target 5 | 250.28 |
Daily price and volume Veeva Systems
| Date |
Closing |
Open |
Range |
Volume |
Thu 04 December 2025 |
242.29 (0.4%) |
241.33 |
238.86 - 246.57 |
0.676 times |
Wed 03 December 2025 |
241.33 (0.5%) |
239.25 |
238.68 - 241.45 |
0.5451 times |
Tue 02 December 2025 |
240.14 (-0.11%) |
241.95 |
238.63 - 243.50 |
0.6416 times |
Mon 01 December 2025 |
240.41 (0.05%) |
237.27 |
236.95 - 242.93 |
0.9936 times |
Fri 28 November 2025 |
240.29 (-0.24%) |
242.00 |
239.54 - 244.91 |
0.441 times |
Wed 26 November 2025 |
240.87 (0.38%) |
240.01 |
238.73 - 244.88 |
0.6334 times |
Tue 25 November 2025 |
239.95 (1.83%) |
236.81 |
235.54 - 241.94 |
1.0166 times |
Mon 24 November 2025 |
235.64 (-3.45%) |
244.99 |
234.50 - 247.62 |
1.0645 times |
Fri 21 November 2025 |
244.06 (-9.77%) |
249.75 |
237.24 - 251.60 |
2.926 times |
Thu 20 November 2025 |
270.50 (-0.92%) |
275.00 |
269.30 - 277.61 |
1.0621 times |
Wed 19 November 2025 |
273.00 (-0.26%) |
273.15 |
270.68 - 274.88 |
0.7368 times |
Weekly price and charts VeevaSystems Strong weekly Stock price targets for VeevaSystems VEEV are 239.62 and 249.24 | Weekly Target 1 | 232.32 | | Weekly Target 2 | 237.3 | | Weekly Target 3 | 241.93666666667 | | Weekly Target 4 | 246.92 | | Weekly Target 5 | 251.56 |
Weekly price and volumes for Veeva Systems
| Date |
Closing |
Open |
Range |
Volume |
Thu 04 December 2025 |
242.29 (0.83%) |
237.27 |
236.95 - 246.57 |
1.012 times |
Fri 28 November 2025 |
240.29 (-1.54%) |
244.99 |
234.50 - 247.62 |
1.118 times |
Fri 21 November 2025 |
244.06 (-16.81%) |
289.29 |
237.24 - 292.96 |
2.6554 times |
Fri 14 November 2025 |
293.36 (-0.51%) |
292.02 |
286.05 - 302.17 |
0.8317 times |
Fri 07 November 2025 |
294.86 (1.26%) |
291.00 |
285.34 - 296.69 |
0.6492 times |
Fri 31 October 2025 |
291.20 (0%) |
286.48 |
285.95 - 291.53 |
0.2707 times |
Fri 31 October 2025 |
291.20 (-0.62%) |
295.06 |
283.41 - 297.81 |
0.8919 times |
Fri 24 October 2025 |
293.02 (3.27%) |
285.07 |
281.92 - 296.55 |
0.7608 times |
Fri 17 October 2025 |
283.73 (-7.34%) |
288.09 |
278.67 - 297.00 |
1.2682 times |
Tue 07 October 2025 |
306.22 (3.35%) |
296.71 |
296.01 - 310.50 |
0.5421 times |
Fri 03 October 2025 |
296.28 (2.07%) |
290.59 |
285.96 - 302.00 |
1.4541 times |
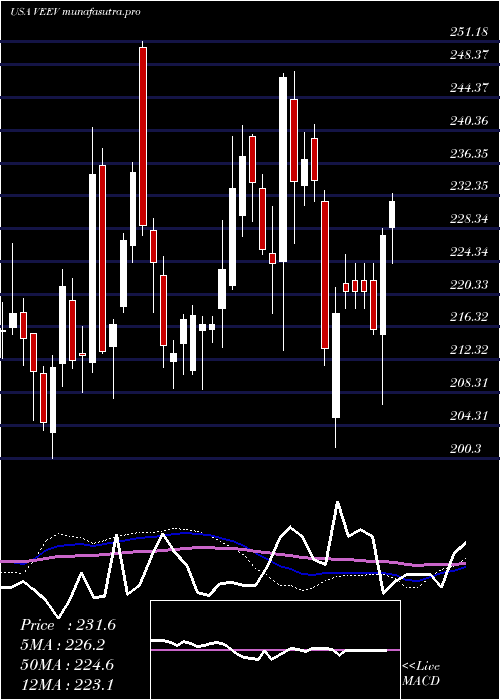
Monthly price and charts VeevaSystems Strong monthly Stock price targets for VeevaSystems VEEV are 239.62 and 249.24 | Monthly Target 1 | 232.32 | | Monthly Target 2 | 237.3 | | Monthly Target 3 | 241.93666666667 | | Monthly Target 4 | 246.92 | | Monthly Target 5 | 251.56 |
Monthly price and volumes Veeva Systems
| Date |
Closing |
Open |
Range |
Volume |
Thu 04 December 2025 |
242.29 (0.83%) |
237.27 |
236.95 - 246.57 |
0.19 times |
Fri 28 November 2025 |
240.29 (-17.48%) |
291.00 |
234.50 - 302.17 |
0.9865 times |
Fri 31 October 2025 |
291.20 (-2.25%) |
294.43 |
278.67 - 310.50 |
0.8557 times |
Tue 30 September 2025 |
297.91 (10.66%) |
265.26 |
262.85 - 299.95 |
1.0938 times |
Fri 29 August 2025 |
269.20 (-5.28%) |
280.00 |
266.33 - 296.02 |
1.1267 times |
Thu 31 July 2025 |
284.20 (-1.31%) |
287.55 |
270.92 - 296.72 |
1.1278 times |
Mon 30 June 2025 |
287.98 (2.96%) |
276.31 |
274.93 - 291.69 |
1.1962 times |
Fri 30 May 2025 |
279.70 (19.69%) |
235.00 |
225.51 - 285.70 |
1.3138 times |
Wed 30 April 2025 |
233.69 (0.89%) |
227.97 |
201.54 - 234.04 |
1.0163 times |
Mon 31 March 2025 |
231.63 (3.34%) |
224.31 |
213.49 - 247.62 |
1.0932 times |
Fri 28 February 2025 |
224.14 (-3.91%) |
230.00 |
218.02 - 240.95 |
0.7366 times |

DMA SMA EMA moving averages of Veeva Systems VEEV
DMA (daily moving average) of Veeva Systems VEEV
| DMA period | DMA value | | 5 day DMA | 240.89 | | 12 day DMA | 248.52 | | 20 day DMA | 266.11 | | 35 day DMA | 276.53 | | 50 day DMA | 280.7 | | 100 day DMA | 280.54 | | 150 day DMA | 274.53 | | 200 day DMA | 262.5 | EMA (exponential moving average) of Veeva Systems VEEV
| EMA period | EMA current | EMA prev | EMA prev2 | | 5 day EMA | 242.1 | 242.01 | 242.35 | | 12 day EMA | 250.32 | 251.78 | 253.68 | | 20 day EMA | 259.16 | 260.93 | 262.99 | | 35 day EMA | 268.36 | 269.89 | 271.57 | | 50 day EMA | 276.4 | 277.79 | 279.28 |
SMA (simple moving average) of Veeva Systems VEEV
| SMA period | SMA current | SMA prev | SMA prev2 | | 5 day SMA | 240.89 | 240.61 | 240.33 | | 12 day SMA | 248.52 | 251.41 | 255.75 | | 20 day SMA | 266.11 | 268.76 | 271.36 | | 35 day SMA | 276.53 | 277.82 | 279.15 | | 50 day SMA | 280.7 | 281.41 | 282.17 | | 100 day SMA | 280.54 | 280.94 | 281.37 | | 150 day SMA | 274.53 | 274.43 | 274.34 | | 200 day SMA | 262.5 | 262.45 | 262.42 |
|
|
