VeecoInstruments VECO full analysis,charts,indicators,moving averages,SMA,DMA,EMA,ADX,MACD,RSIVeeco Instruments VECO WideScreen charts, DMA,SMA,EMA technical analysis, forecast prediction, by indicators ADX,MACD,RSI,CCI USA stock exchange
operates under Technology sector & deals in Industrial Machinery Components
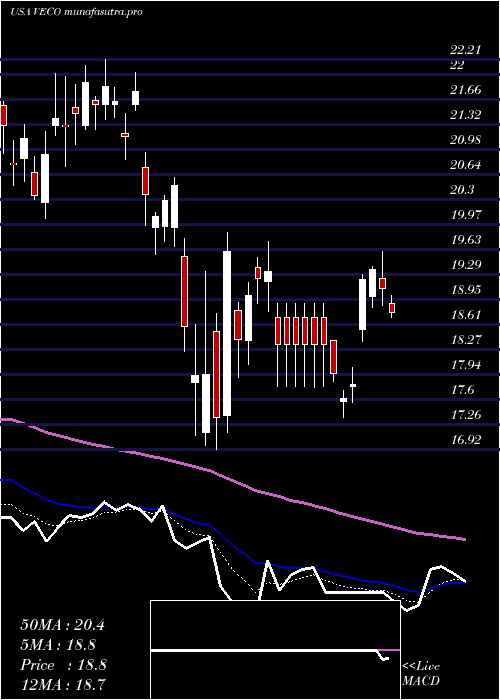
Daily price and charts and targets VeecoInstruments Strong Daily Stock price targets for VeecoInstruments VECO are 31.2 and 32.11 | Daily Target 1 | 30.5 | | Daily Target 2 | 30.99 | | Daily Target 3 | 31.406666666667 | | Daily Target 4 | 31.9 | | Daily Target 5 | 32.32 |
Daily price and volume Veeco Instruments
| Date |
Closing |
Open |
Range |
Volume |
Thu 04 December 2025 |
31.49 (0.13%) |
31.45 |
30.91 - 31.82 |
1.1684 times |
Wed 03 December 2025 |
31.45 (8%) |
29.00 |
28.85 - 31.49 |
1.7593 times |
Tue 02 December 2025 |
29.12 (0.24%) |
29.10 |
28.76 - 29.41 |
0.8345 times |
Mon 01 December 2025 |
29.05 (-0.62%) |
28.92 |
28.71 - 29.27 |
0.7513 times |
Fri 28 November 2025 |
29.23 (0%) |
29.05 |
28.93 - 29.27 |
0.2876 times |
Wed 26 November 2025 |
29.23 (0.03%) |
29.37 |
29.14 - 29.87 |
1.1823 times |
Tue 25 November 2025 |
29.22 (4.13%) |
28.05 |
27.99 - 29.52 |
0.9584 times |
Mon 24 November 2025 |
28.06 (2.41%) |
27.38 |
27.38 - 28.24 |
0.8404 times |
Fri 21 November 2025 |
27.40 (3.83%) |
26.31 |
26.31 - 27.86 |
1.0507 times |
Thu 20 November 2025 |
26.39 (-4.11%) |
28.18 |
26.00 - 28.27 |
1.167 times |
Wed 19 November 2025 |
27.52 (0.55%) |
27.39 |
27.39 - 28.00 |
0.7374 times |
Weekly price and charts VeecoInstruments Strong weekly Stock price targets for VeecoInstruments VECO are 30.1 and 33.21 | Weekly Target 1 | 27.56 | | Weekly Target 2 | 29.53 | | Weekly Target 3 | 30.673333333333 | | Weekly Target 4 | 32.64 | | Weekly Target 5 | 33.78 |
Weekly price and volumes for Veeco Instruments
| Date |
Closing |
Open |
Range |
Volume |
Thu 04 December 2025 |
31.49 (7.73%) |
28.92 |
28.71 - 31.82 |
0.7263 times |
Fri 28 November 2025 |
29.23 (6.68%) |
27.38 |
27.38 - 29.87 |
0.526 times |
Fri 21 November 2025 |
27.40 (-6.1%) |
29.12 |
26.00 - 29.45 |
0.7783 times |
Fri 14 November 2025 |
29.18 (-4.04%) |
31.03 |
27.61 - 31.68 |
1.3858 times |
Fri 07 November 2025 |
30.41 (5.77%) |
30.30 |
28.50 - 30.51 |
1.3294 times |
Fri 31 October 2025 |
28.75 (0%) |
29.11 |
28.33 - 29.27 |
0.1523 times |
Fri 31 October 2025 |
28.75 (-1.91%) |
29.93 |
28.33 - 30.02 |
0.9687 times |
Fri 24 October 2025 |
29.31 (0.45%) |
29.26 |
27.66 - 30.09 |
0.9462 times |
Fri 17 October 2025 |
29.18 (5%) |
28.56 |
27.62 - 30.04 |
1.5135 times |
Fri 10 October 2025 |
27.79 (-12.08%) |
31.61 |
27.77 - 32.84 |
1.6736 times |
Fri 03 October 2025 |
31.61 (5.83%) |
29.90 |
29.50 - 34.45 |
2.1959 times |
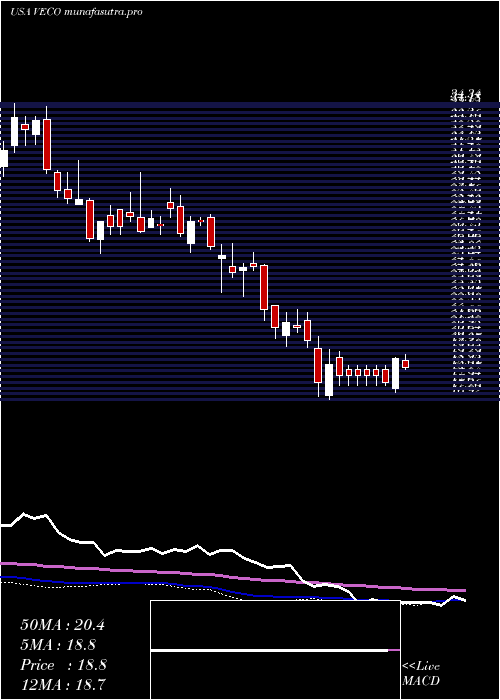
Monthly price and charts VeecoInstruments Strong monthly Stock price targets for VeecoInstruments VECO are 30.1 and 33.21 | Monthly Target 1 | 27.56 | | Monthly Target 2 | 29.53 | | Monthly Target 3 | 30.673333333333 | | Monthly Target 4 | 32.64 | | Monthly Target 5 | 33.78 |
Monthly price and volumes Veeco Instruments
| Date |
Closing |
Open |
Range |
Volume |
Thu 04 December 2025 |
31.49 (7.73%) |
28.92 |
28.71 - 31.82 |
0.1721 times |
Fri 28 November 2025 |
29.23 (1.67%) |
30.30 |
26.00 - 31.68 |
0.9526 times |
Fri 31 October 2025 |
28.75 (-5.52%) |
32.27 |
27.62 - 34.45 |
1.6827 times |
Tue 30 September 2025 |
30.43 (24.1%) |
23.81 |
23.31 - 30.84 |
1.1086 times |
Fri 29 August 2025 |
24.52 (18%) |
20.28 |
19.29 - 25.42 |
1.4485 times |
Thu 31 July 2025 |
20.78 (2.26%) |
20.15 |
19.92 - 22.30 |
0.826 times |
Mon 30 June 2025 |
20.32 (5.23%) |
19.23 |
19.04 - 22.10 |
0.8691 times |
Fri 30 May 2025 |
19.31 (3.26%) |
18.98 |
18.31 - 21.52 |
0.9665 times |
Wed 30 April 2025 |
18.70 (-6.87%) |
19.94 |
16.92 - 20.61 |
1.0059 times |
Mon 31 March 2025 |
20.08 (-9.71%) |
22.48 |
19.57 - 22.48 |
0.9679 times |
Fri 28 February 2025 |
22.24 (-12.37%) |
24.75 |
21.59 - 26.11 |
0.9568 times |

DMA SMA EMA moving averages of Veeco Instruments VECO
DMA (daily moving average) of Veeco Instruments VECO
| DMA period | DMA value | | 5 day DMA | 30.07 | | 12 day DMA | 28.79 | | 20 day DMA | 29.2 | | 35 day DMA | 29.16 | | 50 day DMA | 29.45 | | 100 day DMA | 26.71 | | 150 day DMA | 24.6 | | 200 day DMA | 23.52 | EMA (exponential moving average) of Veeco Instruments VECO
| EMA period | EMA current | EMA prev | EMA prev2 | | 5 day EMA | 30.35 | 29.78 | 28.95 | | 12 day EMA | 29.55 | 29.2 | 28.79 | | 20 day EMA | 29.35 | 29.12 | 28.87 | | 35 day EMA | 29.34 | 29.21 | 29.08 | | 50 day EMA | 29.48 | 29.4 | 29.32 |
SMA (simple moving average) of Veeco Instruments VECO
| SMA period | SMA current | SMA prev | SMA prev2 | | 5 day SMA | 30.07 | 29.62 | 29.17 | | 12 day SMA | 28.79 | 28.55 | 28.36 | | 20 day SMA | 29.2 | 29.1 | 28.98 | | 35 day SMA | 29.16 | 29.09 | 28.99 | | 50 day SMA | 29.45 | 29.41 | 29.37 | | 100 day SMA | 26.71 | 26.6 | 26.49 | | 150 day SMA | 24.6 | 24.52 | 24.43 | | 200 day SMA | 23.52 | 23.49 | 23.45 |
|
|
