VictoryCapital VCTR full analysis,charts,indicators,moving averages,SMA,DMA,EMA,ADX,MACD,RSIVictory Capital VCTR WideScreen charts, DMA,SMA,EMA technical analysis, forecast prediction, by indicators ADX,MACD,RSI,CCI USA stock exchange
operates under Finance sector & deals in Investment Managers
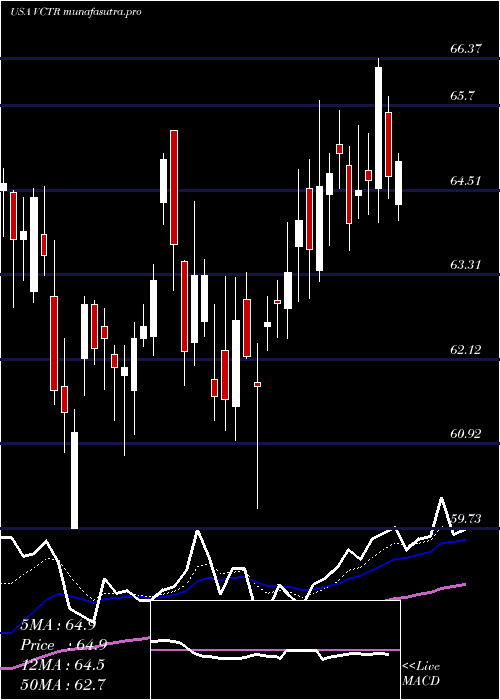
Daily price and charts and targets VictoryCapital Strong Daily Stock price targets for VictoryCapital VCTR are 62.75 and 63.76 | Daily Target 1 | 61.96 | | Daily Target 2 | 62.52 | | Daily Target 3 | 62.97 | | Daily Target 4 | 63.53 | | Daily Target 5 | 63.98 |
Daily price and volume Victory Capital
| Date |
Closing |
Open |
Range |
Volume |
Thu 04 December 2025 |
63.08 (1.11%) |
62.51 |
62.41 - 63.42 |
1.4101 times |
Wed 03 December 2025 |
62.39 (2.68%) |
60.76 |
60.76 - 62.78 |
1.242 times |
Tue 02 December 2025 |
60.76 (-1.46%) |
61.75 |
60.74 - 61.75 |
0.7864 times |
Mon 01 December 2025 |
61.66 (-1.96%) |
62.29 |
61.63 - 63.00 |
0.9854 times |
Fri 28 November 2025 |
62.89 (-0.47%) |
63.50 |
62.53 - 63.51 |
0.5339 times |
Wed 26 November 2025 |
63.19 (0.16%) |
62.75 |
62.75 - 63.87 |
1.1081 times |
Tue 25 November 2025 |
63.09 (1.69%) |
62.20 |
62.04 - 63.31 |
0.777 times |
Mon 24 November 2025 |
62.04 (-1.63%) |
63.04 |
61.88 - 63.48 |
0.7262 times |
Fri 21 November 2025 |
63.07 (2.17%) |
61.92 |
61.92 - 63.77 |
1.2211 times |
Thu 20 November 2025 |
61.73 (-2.06%) |
63.97 |
61.55 - 64.66 |
1.2099 times |
Wed 19 November 2025 |
63.03 (1.12%) |
62.39 |
62.30 - 63.40 |
1.2055 times |
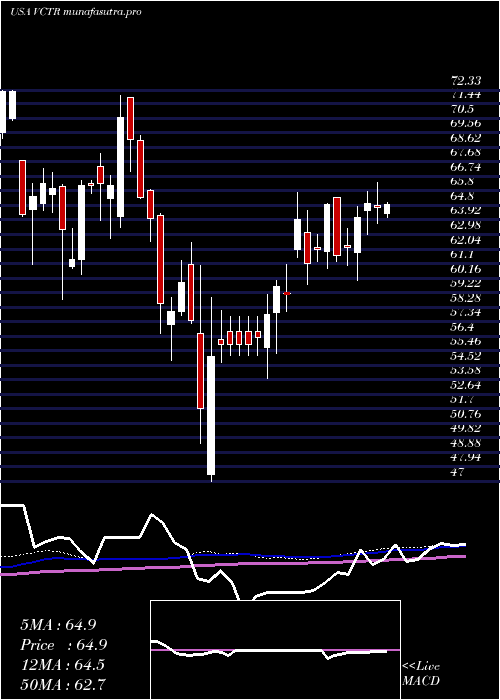
Weekly price and charts VictoryCapital Strong weekly Stock price targets for VictoryCapital VCTR are 61.91 and 64.59 | Weekly Target 1 | 59.73 | | Weekly Target 2 | 61.41 | | Weekly Target 3 | 62.413333333333 | | Weekly Target 4 | 64.09 | | Weekly Target 5 | 65.09 |
Weekly price and volumes for Victory Capital
| Date |
Closing |
Open |
Range |
Volume |
Thu 04 December 2025 |
63.08 (0.3%) |
62.29 |
60.74 - 63.42 |
1.043 times |
Fri 28 November 2025 |
62.89 (-0.29%) |
63.04 |
61.88 - 63.87 |
0.7415 times |
Fri 21 November 2025 |
63.07 (-0.43%) |
63.15 |
61.24 - 64.66 |
1.4876 times |
Fri 14 November 2025 |
63.34 (3.48%) |
61.99 |
60.70 - 64.27 |
1.2671 times |
Fri 07 November 2025 |
61.21 (-1.7%) |
61.49 |
57.03 - 62.78 |
1.1364 times |
Fri 31 October 2025 |
62.27 (0%) |
61.50 |
60.65 - 62.71 |
0.2413 times |
Fri 31 October 2025 |
62.27 (-2.04%) |
63.71 |
60.65 - 64.89 |
0.9288 times |
Fri 24 October 2025 |
63.57 (-2.68%) |
65.41 |
63.07 - 66.26 |
0.7227 times |
Fri 17 October 2025 |
65.32 (-1%) |
66.81 |
65.00 - 69.10 |
0.996 times |
Fri 10 October 2025 |
65.98 (0.92%) |
65.78 |
65.25 - 68.44 |
1.4355 times |
Fri 03 October 2025 |
65.38 (-0.55%) |
65.93 |
62.33 - 65.98 |
1.6092 times |
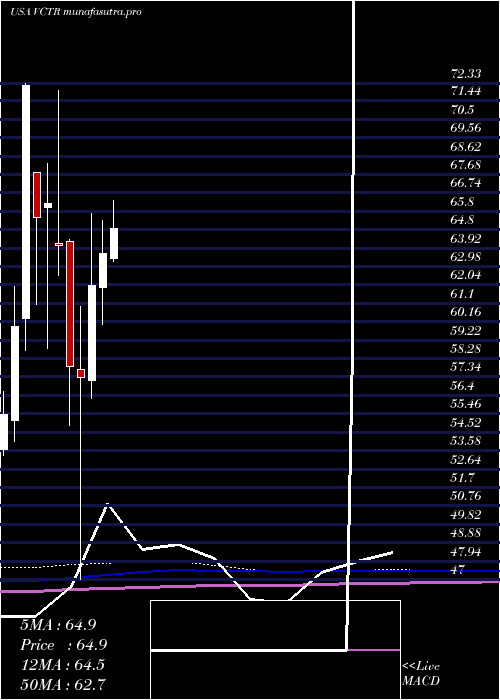
Monthly price and charts VictoryCapital Strong monthly Stock price targets for VictoryCapital VCTR are 61.91 and 64.59 | Monthly Target 1 | 59.73 | | Monthly Target 2 | 61.41 | | Monthly Target 3 | 62.413333333333 | | Monthly Target 4 | 64.09 | | Monthly Target 5 | 65.09 |
Monthly price and volumes Victory Capital
| Date |
Closing |
Open |
Range |
Volume |
Thu 04 December 2025 |
63.08 (0.3%) |
62.29 |
60.74 - 63.42 |
0.2028 times |
Fri 28 November 2025 |
62.89 (1%) |
61.49 |
57.03 - 64.66 |
0.9007 times |
Fri 31 October 2025 |
62.27 (-3.84%) |
64.15 |
60.65 - 69.10 |
1.0388 times |
Tue 30 September 2025 |
64.76 (-9.15%) |
69.93 |
63.90 - 73.00 |
1.7059 times |
Fri 29 August 2025 |
71.28 (3.44%) |
67.41 |
65.38 - 72.98 |
1.585 times |
Thu 31 July 2025 |
68.91 (8.23%) |
63.38 |
63.22 - 72.06 |
1.5007 times |
Mon 30 June 2025 |
63.67 (2.68%) |
61.89 |
60.01 - 65.35 |
0.8266 times |
Fri 30 May 2025 |
62.01 (8.24%) |
57.17 |
56.25 - 65.71 |
0.7619 times |
Wed 30 April 2025 |
57.29 (-1%) |
57.74 |
47.00 - 60.94 |
0.7398 times |
Mon 31 March 2025 |
57.87 (-9.63%) |
64.24 |
54.84 - 64.37 |
0.7378 times |
Fri 28 February 2025 |
64.04 (-3.23%) |
64.14 |
62.53 - 71.96 |
0.6257 times |
DMA SMA EMA moving averages of Victory Capital VCTR
DMA (daily moving average) of Victory Capital VCTR
| DMA period | DMA value | | 5 day DMA | 62.16 | | 12 day DMA | 62.44 | | 20 day DMA | 62.39 | | 35 day DMA | 62.93 | | 50 day DMA | 63.87 | | 100 day DMA | 66.84 | | 150 day DMA | 65.46 | | 200 day DMA | 63.71 | EMA (exponential moving average) of Victory Capital VCTR
| EMA period | EMA current | EMA prev | EMA prev2 | | 5 day EMA | 62.4 | 62.06 | 61.89 | | 12 day EMA | 62.43 | 62.31 | 62.29 | | 20 day EMA | 62.59 | 62.54 | 62.56 | | 35 day EMA | 63.29 | 63.3 | 63.35 | | 50 day EMA | 63.94 | 63.98 | 64.05 |
SMA (simple moving average) of Victory Capital VCTR
| SMA period | SMA current | SMA prev | SMA prev2 | | 5 day SMA | 62.16 | 62.18 | 62.32 | | 12 day SMA | 62.44 | 62.33 | 62.41 | | 20 day SMA | 62.39 | 62.36 | 62.32 | | 35 day SMA | 62.93 | 63.1 | 63.26 | | 50 day SMA | 63.87 | 63.93 | 64.01 | | 100 day SMA | 66.84 | 66.84 | 66.87 | | 150 day SMA | 65.46 | 65.42 | 65.39 | | 200 day SMA | 63.71 | 63.73 | 63.77 |
|
|
