VanguardLong VCLT full analysis,charts,indicators,moving averages,SMA,DMA,EMA,ADX,MACD,RSIVanguard Long VCLT WideScreen charts, DMA,SMA,EMA technical analysis, forecast prediction, by indicators ADX,MACD,RSI,CCI USA stock exchange
operates under N A sector & deals in N A
Daily price and charts and targets VanguardLong Strong Daily Stock price targets for VanguardLong VCLT are 76.61 and 76.88 | Daily Target 1 | 76.54 | | Daily Target 2 | 76.67 | | Daily Target 3 | 76.81 | | Daily Target 4 | 76.94 | | Daily Target 5 | 77.08 |
Daily price and volume Vanguard Long
| Date |
Closing |
Open |
Range |
Volume |
Thu 04 December 2025 |
76.80 (-0.23%) |
76.95 |
76.68 - 76.95 |
0.4483 times |
Wed 03 December 2025 |
76.98 (0.31%) |
76.82 |
76.75 - 77.07 |
0.7922 times |
Tue 02 December 2025 |
76.74 (0.05%) |
76.63 |
76.60 - 76.88 |
1.2135 times |
Mon 01 December 2025 |
76.70 (-1.31%) |
76.58 |
76.53 - 76.77 |
1.5124 times |
Fri 28 November 2025 |
77.72 (-0.28%) |
77.80 |
77.50 - 77.89 |
1.0328 times |
Wed 26 November 2025 |
77.94 (0.54%) |
77.59 |
77.40 - 77.96 |
1.0424 times |
Tue 25 November 2025 |
77.52 (0.35%) |
77.37 |
77.33 - 77.77 |
1.0872 times |
Mon 24 November 2025 |
77.25 (0.68%) |
77.12 |
76.99 - 77.29 |
0.9731 times |
Fri 21 November 2025 |
76.73 (0.39%) |
76.76 |
76.46 - 76.76 |
0.8334 times |
Thu 20 November 2025 |
76.43 (0.13%) |
76.57 |
76.35 - 76.73 |
1.0646 times |
Wed 19 November 2025 |
76.33 (0.01%) |
76.49 |
76.26 - 76.63 |
0.8595 times |
Weekly price and charts VanguardLong Strong weekly Stock price targets for VanguardLong VCLT are 76.67 and 77.21 | Weekly Target 1 | 76.26 | | Weekly Target 2 | 76.53 | | Weekly Target 3 | 76.8 | | Weekly Target 4 | 77.07 | | Weekly Target 5 | 77.34 |
Weekly price and volumes for Vanguard Long
| Date |
Closing |
Open |
Range |
Volume |
Thu 04 December 2025 |
76.80 (-1.18%) |
76.58 |
76.53 - 77.07 |
0.9875 times |
Fri 28 November 2025 |
77.72 (1.29%) |
77.12 |
76.99 - 77.96 |
1.0296 times |
Fri 21 November 2025 |
76.73 (0.66%) |
76.33 |
76.20 - 76.76 |
1.1772 times |
Fri 14 November 2025 |
76.23 (-0.7%) |
76.84 |
76.23 - 77.35 |
1.0142 times |
Fri 07 November 2025 |
76.77 (-0.84%) |
76.64 |
76.50 - 77.15 |
1.311 times |
Fri 31 October 2025 |
77.42 (0%) |
77.98 |
77.38 - 78.04 |
0.2194 times |
Fri 31 October 2025 |
77.42 (-1.94%) |
79.02 |
77.38 - 79.28 |
1.2799 times |
Fri 24 October 2025 |
78.95 (0.6%) |
78.75 |
78.66 - 79.18 |
0.9185 times |
Fri 17 October 2025 |
78.48 (1.15%) |
77.57 |
77.41 - 78.80 |
0.9652 times |
Fri 10 October 2025 |
77.59 (-0.23%) |
77.41 |
77.15 - 77.80 |
1.0975 times |
Fri 03 October 2025 |
77.77 (0.56%) |
77.68 |
77.39 - 78.08 |
0.9325 times |
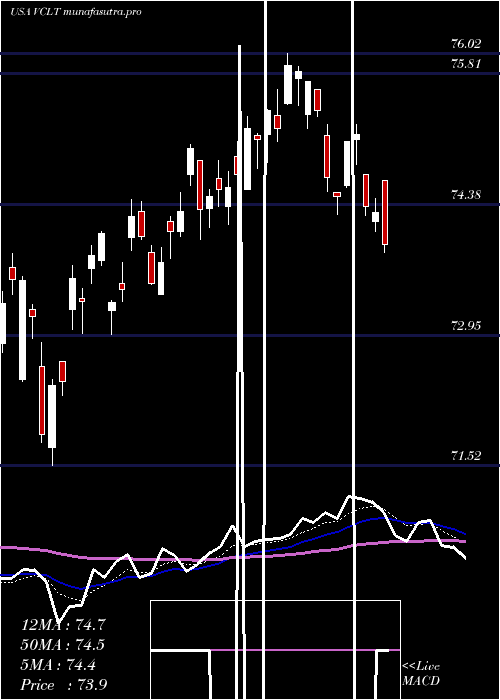
Monthly price and charts VanguardLong Strong monthly Stock price targets for VanguardLong VCLT are 76.67 and 77.21 | Monthly Target 1 | 76.26 | | Monthly Target 2 | 76.53 | | Monthly Target 3 | 76.8 | | Monthly Target 4 | 77.07 | | Monthly Target 5 | 77.34 |
Monthly price and volumes Vanguard Long
| Date |
Closing |
Open |
Range |
Volume |
Thu 04 December 2025 |
76.80 (-1.18%) |
76.58 |
76.53 - 77.07 |
0.2647 times |
Fri 28 November 2025 |
77.72 (0.39%) |
76.64 |
76.20 - 77.96 |
1.2148 times |
Fri 31 October 2025 |
77.42 (-0.3%) |
77.66 |
77.15 - 79.28 |
1.3244 times |
Tue 30 September 2025 |
77.65 (2.83%) |
74.73 |
74.55 - 78.81 |
1.2167 times |
Fri 29 August 2025 |
75.51 (0.15%) |
75.55 |
75.21 - 76.41 |
1.5044 times |
Thu 31 July 2025 |
75.40 (-0.66%) |
75.76 |
73.36 - 75.88 |
0.7431 times |
Mon 30 June 2025 |
75.90 (2.48%) |
73.22 |
72.96 - 76.02 |
0.8067 times |
Fri 30 May 2025 |
74.06 (-0.6%) |
74.40 |
71.52 - 74.40 |
0.9749 times |
Wed 30 April 2025 |
74.51 (-1.84%) |
75.77 |
70.61 - 76.76 |
1.315 times |
Mon 31 March 2025 |
75.91 (-1.81%) |
76.85 |
74.71 - 77.40 |
0.6353 times |
Fri 28 February 2025 |
77.31 (2.96%) |
75.16 |
74.21 - 77.50 |
0.726 times |
DMA SMA EMA moving averages of Vanguard Long VCLT
DMA (daily moving average) of Vanguard Long VCLT
| DMA period | DMA value | | 5 day DMA | 76.99 | | 12 day DMA | 76.96 | | 20 day DMA | 76.89 | | 35 day DMA | 77.5 | | 50 day DMA | 77.55 | | 100 day DMA | 76.85 | | 150 day DMA | 75.92 | | 200 day DMA | 75.74 | EMA (exponential moving average) of Vanguard Long VCLT
| EMA period | EMA current | EMA prev | EMA prev2 | | 5 day EMA | 76.95 | 77.03 | 77.05 | | 12 day EMA | 77 | 77.04 | 77.05 | | 20 day EMA | 77.09 | 77.12 | 77.13 | | 35 day EMA | 77.25 | 77.28 | 77.3 | | 50 day EMA | 77.5 | 77.53 | 77.55 |
SMA (simple moving average) of Vanguard Long VCLT
| SMA period | SMA current | SMA prev | SMA prev2 | | 5 day SMA | 76.99 | 77.22 | 77.32 | | 12 day SMA | 76.96 | 76.92 | 76.85 | | 20 day SMA | 76.89 | 76.88 | 76.87 | | 35 day SMA | 77.5 | 77.54 | 77.58 | | 50 day SMA | 77.55 | 77.56 | 77.58 | | 100 day SMA | 76.85 | 76.82 | 76.8 | | 150 day SMA | 75.92 | 75.9 | 75.89 | | 200 day SMA | 75.74 | 75.74 | 75.73 |
|
|
