VericelCorporation VCEL full analysis,charts,indicators,moving averages,SMA,DMA,EMA,ADX,MACD,RSIVericel Corporation VCEL WideScreen charts, DMA,SMA,EMA technical analysis, forecast prediction, by indicators ADX,MACD,RSI,CCI USA stock exchange
operates under Health Care sector & deals in Biotechnology Biological Products No Diagnostic Substances
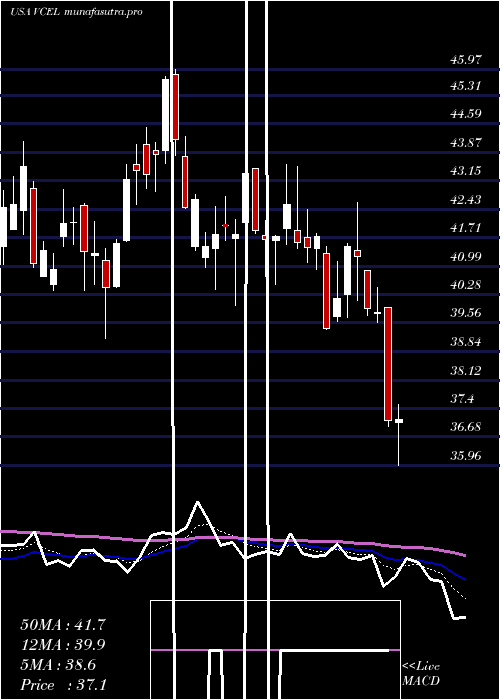
Daily price and charts and targets VericelCorporation Strong Daily Stock price targets for VericelCorporation VCEL are 35.63 and 36.9 | Daily Target 1 | 34.65 | | Daily Target 2 | 35.33 | | Daily Target 3 | 35.916666666667 | | Daily Target 4 | 36.6 | | Daily Target 5 | 37.19 |
Daily price and volume Vericel Corporation
| Date |
Closing |
Open |
Range |
Volume |
Mon 20 October 2025 |
36.02 (1.98%) |
35.75 |
35.23 - 36.50 |
0.6251 times |
Fri 17 October 2025 |
35.32 (1.64%) |
34.38 |
33.91 - 35.32 |
0.8859 times |
Thu 16 October 2025 |
34.75 (3.45%) |
33.59 |
33.14 - 35.76 |
1.4298 times |
Wed 15 October 2025 |
33.59 (-3.03%) |
34.23 |
33.58 - 35.05 |
1.6353 times |
Tue 14 October 2025 |
34.64 (3.43%) |
33.30 |
32.90 - 35.70 |
1.3456 times |
Mon 13 October 2025 |
33.49 (5.15%) |
32.21 |
31.63 - 33.51 |
0.9997 times |
Fri 10 October 2025 |
31.85 (-2.81%) |
33.01 |
31.34 - 33.01 |
0.8414 times |
Thu 09 October 2025 |
32.77 (-3.98%) |
34.10 |
32.74 - 34.55 |
0.8964 times |
Wed 08 October 2025 |
34.13 (3.08%) |
33.48 |
32.94 - 34.45 |
0.5847 times |
Tue 07 October 2025 |
33.11 (-1.87%) |
33.92 |
33.07 - 33.99 |
0.7562 times |
Mon 06 October 2025 |
33.74 (4.01%) |
32.53 |
32.36 - 33.84 |
0.771 times |
Weekly price and charts VericelCorporation Strong weekly Stock price targets for VericelCorporation VCEL are 35.63 and 36.9 | Weekly Target 1 | 34.65 | | Weekly Target 2 | 35.33 | | Weekly Target 3 | 35.916666666667 | | Weekly Target 4 | 36.6 | | Weekly Target 5 | 37.19 |
Weekly price and volumes for Vericel Corporation
| Date |
Closing |
Open |
Range |
Volume |
Mon 20 October 2025 |
36.02 (1.98%) |
35.75 |
35.23 - 36.50 |
0.1294 times |
Fri 17 October 2025 |
35.32 (10.89%) |
32.21 |
31.63 - 35.76 |
1.3031 times |
Fri 10 October 2025 |
31.85 (-1.82%) |
32.53 |
31.34 - 34.55 |
0.7967 times |
Fri 03 October 2025 |
32.44 (7.31%) |
30.28 |
29.88 - 33.24 |
1.0112 times |
Fri 26 September 2025 |
30.23 (-4.58%) |
31.65 |
29.24 - 32.08 |
1.1526 times |
Fri 19 September 2025 |
31.68 (-1.55%) |
32.44 |
29.93 - 33.25 |
2.0901 times |
Fri 12 September 2025 |
32.18 (-5.49%) |
34.00 |
30.26 - 34.20 |
1.5797 times |
Fri 05 September 2025 |
34.05 (-6.35%) |
35.77 |
33.18 - 36.61 |
1.0116 times |
Fri 29 August 2025 |
36.36 (0%) |
35.97 |
35.84 - 36.81 |
0.1042 times |
Fri 29 August 2025 |
36.36 (-1.81%) |
36.94 |
35.18 - 37.17 |
0.8215 times |
Fri 22 August 2025 |
37.03 (2.07%) |
36.29 |
34.55 - 37.50 |
0.8007 times |

Monthly price and charts VericelCorporation Strong monthly Stock price targets for VericelCorporation VCEL are 33.26 and 39.26 | Monthly Target 1 | 28.34 | | Monthly Target 2 | 32.18 | | Monthly Target 3 | 34.34 | | Monthly Target 4 | 38.18 | | Monthly Target 5 | 40.34 |
Monthly price and volumes Vericel Corporation
| Date |
Closing |
Open |
Range |
Volume |
Mon 20 October 2025 |
36.02 (14.46%) |
31.33 |
30.50 - 36.50 |
0.7805 times |
Tue 30 September 2025 |
31.47 (-13.45%) |
35.77 |
29.24 - 36.61 |
1.8385 times |
Fri 29 August 2025 |
36.36 (4.06%) |
34.38 |
33.09 - 38.08 |
1.0192 times |
Thu 31 July 2025 |
34.94 (-17.88%) |
41.90 |
34.87 - 43.51 |
1.1829 times |
Mon 30 June 2025 |
42.55 (3.03%) |
41.13 |
39.16 - 45.97 |
0.8205 times |
Fri 30 May 2025 |
41.30 (8.63%) |
37.98 |
37.39 - 44.41 |
1.1153 times |
Wed 30 April 2025 |
38.02 (-14.79%) |
44.34 |
37.76 - 44.97 |
1.0021 times |
Mon 31 March 2025 |
44.62 (-13%) |
51.20 |
42.53 - 52.06 |
0.7329 times |
Fri 28 February 2025 |
51.29 (-12.38%) |
58.25 |
49.22 - 63.00 |
0.6492 times |
Fri 31 January 2025 |
58.54 (6.61%) |
55.15 |
53.00 - 61.99 |
0.8589 times |
Tue 31 December 2024 |
54.91 (-6.54%) |
56.70 |
54.17 - 59.95 |
0.4609 times |

DMA SMA EMA moving averages of Vericel Corporation VCEL
DMA (daily moving average) of Vericel Corporation VCEL
| DMA period | DMA value | | 5 day DMA | 34.86 | | 12 day DMA | 33.82 | | 20 day DMA | 32.65 | | 35 day DMA | 32.62 | | 50 day DMA | 33.71 | | 100 day DMA | 36.99 | | 150 day DMA | 38.68 | | 200 day DMA | 42.96 | EMA (exponential moving average) of Vericel Corporation VCEL
| EMA period | EMA current | EMA prev | EMA prev2 | | 5 day EMA | 34.93 | 34.39 | 33.93 | | 12 day EMA | 33.94 | 33.56 | 33.24 | | 20 day EMA | 33.46 | 33.19 | 32.97 | | 35 day EMA | 33.66 | 33.52 | 33.41 | | 50 day EMA | 34.03 | 33.95 | 33.89 |
SMA (simple moving average) of Vericel Corporation VCEL
| SMA period | SMA current | SMA prev | SMA prev2 | | 5 day SMA | 34.86 | 34.36 | 33.66 | | 12 day SMA | 33.82 | 33.45 | 33.08 | | 20 day SMA | 32.65 | 32.44 | 32.26 | | 35 day SMA | 32.62 | 32.63 | 32.66 | | 50 day SMA | 33.71 | 33.69 | 33.71 | | 100 day SMA | 36.99 | 37.05 | 37.11 | | 150 day SMA | 38.68 | 38.75 | 38.82 | | 200 day SMA | 42.96 | 43.05 | 43.15 |
|
|
