InvescoBond VBF full analysis,charts,indicators,moving averages,SMA,DMA,EMA,ADX,MACD,RSIInvesco Bond VBF WideScreen charts, DMA,SMA,EMA technical analysis, forecast prediction, by indicators ADX,MACD,RSI,CCI USA stock exchange
operates under N A sector & deals in N A
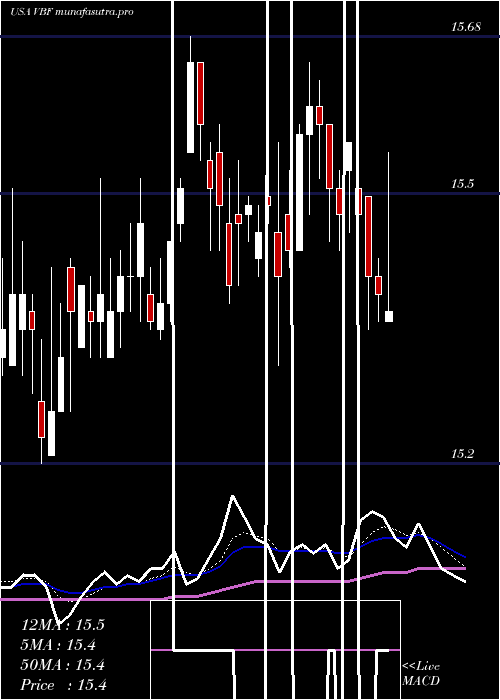
Daily price and charts and targets InvescoBond Strong Daily Stock price targets for InvescoBond VBF are 15.56 and 15.62 | Daily Target 1 | 15.51 | | Daily Target 2 | 15.55 | | Daily Target 3 | 15.573333333333 | | Daily Target 4 | 15.61 | | Daily Target 5 | 15.63 |
Daily price and volume Invesco Bond
| Date |
Closing |
Open |
Range |
Volume |
Thu 04 December 2025 |
15.58 (0%) |
15.55 |
15.54 - 15.60 |
0.6161 times |
Wed 03 December 2025 |
15.58 (-0.19%) |
15.53 |
15.53 - 15.68 |
1.4994 times |
Tue 02 December 2025 |
15.61 (0.13%) |
15.61 |
15.57 - 15.66 |
0.7793 times |
Mon 01 December 2025 |
15.59 (-0.76%) |
15.60 |
15.52 - 15.70 |
0.7426 times |
Fri 28 November 2025 |
15.71 (0.38%) |
15.65 |
15.65 - 15.80 |
0.6242 times |
Wed 26 November 2025 |
15.65 (0.19%) |
15.58 |
15.58 - 15.68 |
0.4386 times |
Tue 25 November 2025 |
15.62 (0.51%) |
15.55 |
15.52 - 15.77 |
1.5606 times |
Mon 24 November 2025 |
15.54 (0.32%) |
15.52 |
15.48 - 15.59 |
1.4667 times |
Fri 21 November 2025 |
15.49 (-0.19%) |
15.49 |
15.41 - 15.53 |
0.7752 times |
Thu 20 November 2025 |
15.52 (0.65%) |
15.43 |
15.38 - 15.59 |
1.4973 times |
Wed 19 November 2025 |
15.42 (-0.26%) |
15.48 |
15.39 - 15.57 |
1.5626 times |
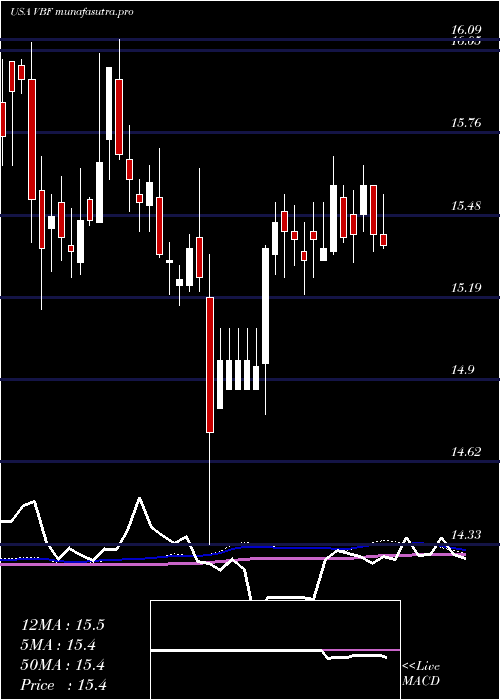
Weekly price and charts InvescoBond Strong weekly Stock price targets for InvescoBond VBF are 15.46 and 15.64 | Weekly Target 1 | 15.42 | | Weekly Target 2 | 15.5 | | Weekly Target 3 | 15.6 | | Weekly Target 4 | 15.68 | | Weekly Target 5 | 15.78 |
Weekly price and volumes for Invesco Bond
| Date |
Closing |
Open |
Range |
Volume |
Thu 04 December 2025 |
15.58 (-0.83%) |
15.60 |
15.52 - 15.70 |
0.844 times |
Fri 28 November 2025 |
15.71 (1.42%) |
15.52 |
15.48 - 15.80 |
0.9491 times |
Fri 21 November 2025 |
15.49 (-0.45%) |
15.49 |
15.38 - 15.68 |
1.3823 times |
Fri 14 November 2025 |
15.56 (-0.38%) |
15.65 |
15.52 - 15.83 |
1.7084 times |
Fri 07 November 2025 |
15.62 (-0.64%) |
15.66 |
15.55 - 15.85 |
0.613 times |
Fri 31 October 2025 |
15.72 (0%) |
15.70 |
15.64 - 15.74 |
0.1165 times |
Fri 31 October 2025 |
15.72 (0.19%) |
15.73 |
15.64 - 15.86 |
0.7489 times |
Fri 24 October 2025 |
15.69 (0.38%) |
15.67 |
15.63 - 15.82 |
1.1929 times |
Fri 17 October 2025 |
15.63 (-0.76%) |
15.75 |
15.51 - 15.81 |
1.4258 times |
Fri 10 October 2025 |
15.75 (-0.32%) |
15.77 |
15.64 - 15.85 |
1.0189 times |
Fri 03 October 2025 |
15.80 (0.25%) |
15.76 |
15.70 - 15.86 |
0.4785 times |
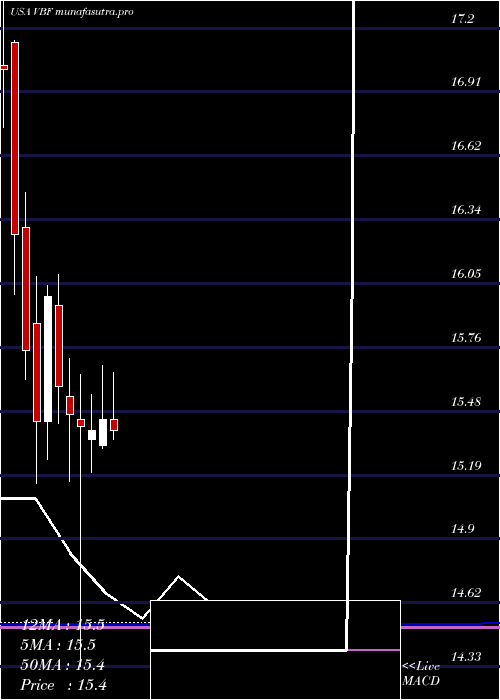
Monthly price and charts InvescoBond Strong monthly Stock price targets for InvescoBond VBF are 15.46 and 15.64 | Monthly Target 1 | 15.42 | | Monthly Target 2 | 15.5 | | Monthly Target 3 | 15.6 | | Monthly Target 4 | 15.68 | | Monthly Target 5 | 15.78 |
Monthly price and volumes Invesco Bond
| Date |
Closing |
Open |
Range |
Volume |
Thu 04 December 2025 |
15.58 (-0.83%) |
15.60 |
15.52 - 15.70 |
0.2629 times |
Fri 28 November 2025 |
15.71 (-0.06%) |
15.66 |
15.38 - 15.85 |
1.4492 times |
Fri 31 October 2025 |
15.72 (-0.38%) |
15.79 |
15.51 - 15.86 |
1.4814 times |
Tue 30 September 2025 |
15.78 (2%) |
15.42 |
15.34 - 15.98 |
0.897 times |
Fri 29 August 2025 |
15.47 (0.52%) |
15.41 |
15.30 - 15.63 |
1.2385 times |
Thu 31 July 2025 |
15.39 (-0.32%) |
15.44 |
15.21 - 15.65 |
1.1014 times |
Mon 30 June 2025 |
15.44 (0.32%) |
15.32 |
15.31 - 15.68 |
0.9491 times |
Fri 30 May 2025 |
15.39 (-0.13%) |
15.35 |
15.20 - 15.55 |
0.7611 times |
Wed 30 April 2025 |
15.41 (-0.32%) |
15.44 |
14.33 - 15.64 |
0.8473 times |
Mon 31 March 2025 |
15.46 (-0.83%) |
15.54 |
15.16 - 15.71 |
1.0121 times |
Fri 28 February 2025 |
15.59 (-2.5%) |
15.95 |
15.42 - 16.09 |
1.0085 times |
DMA SMA EMA moving averages of Invesco Bond VBF
DMA (daily moving average) of Invesco Bond VBF
| DMA period | DMA value | | 5 day DMA | 15.61 | | 12 day DMA | 15.56 | | 20 day DMA | 15.58 | | 35 day DMA | 15.63 | | 50 day DMA | 15.67 | | 100 day DMA | 15.59 | | 150 day DMA | 15.54 | | 200 day DMA | 15.47 | EMA (exponential moving average) of Invesco Bond VBF
| EMA period | EMA current | EMA prev | EMA prev2 | | 5 day EMA | 15.59 | 15.6 | 15.61 | | 12 day EMA | 15.59 | 15.59 | 15.59 | | 20 day EMA | 15.61 | 15.61 | 15.61 | | 35 day EMA | 15.63 | 15.63 | 15.63 | | 50 day EMA | 15.69 | 15.69 | 15.69 |
SMA (simple moving average) of Invesco Bond VBF
| SMA period | SMA current | SMA prev | SMA prev2 | | 5 day SMA | 15.61 | 15.63 | 15.64 | | 12 day SMA | 15.56 | 15.56 | 15.56 | | 20 day SMA | 15.58 | 15.59 | 15.59 | | 35 day SMA | 15.63 | 15.64 | 15.64 | | 50 day SMA | 15.67 | 15.68 | 15.68 | | 100 day SMA | 15.59 | 15.59 | 15.59 | | 150 day SMA | 15.54 | 15.54 | 15.54 | | 200 day SMA | 15.47 | 15.47 | 15.47 |
|
|
