ValueLine VALU full analysis,charts,indicators,moving averages,SMA,DMA,EMA,ADX,MACD,RSIValue Line VALU WideScreen charts, DMA,SMA,EMA technical analysis, forecast prediction, by indicators ADX,MACD,RSI,CCI USA stock exchange
operates under Finance sector & deals in Investment Managers
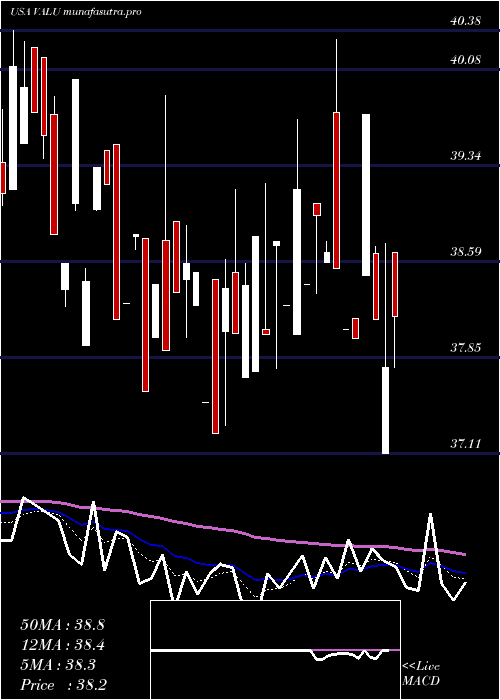
Daily price and charts and targets ValueLine Strong Daily Stock price targets for ValueLine VALU are 36.28 and 37.04 | Daily Target 1 | 36.1 | | Daily Target 2 | 36.46 | | Daily Target 3 | 36.86 | | Daily Target 4 | 37.22 | | Daily Target 5 | 37.62 |
Daily price and volume Value Line
| Date |
Closing |
Open |
Range |
Volume |
Thu 04 December 2025 |
36.82 (-4.61%) |
37.26 |
36.50 - 37.26 |
0.7175 times |
Wed 03 December 2025 |
38.60 (4.98%) |
36.88 |
36.68 - 38.60 |
2.0179 times |
Tue 02 December 2025 |
36.77 (1.46%) |
36.50 |
36.32 - 37.00 |
2.5112 times |
Mon 01 December 2025 |
36.24 (-2.34%) |
36.66 |
36.24 - 36.76 |
0.8072 times |
Fri 28 November 2025 |
37.11 (0.03%) |
36.74 |
36.74 - 37.11 |
0.2691 times |
Wed 26 November 2025 |
37.10 (-0.51%) |
36.74 |
36.74 - 37.10 |
0.5381 times |
Tue 25 November 2025 |
37.29 (3.5%) |
37.78 |
36.86 - 38.17 |
0.852 times |
Mon 24 November 2025 |
36.03 (-2.38%) |
36.48 |
36.03 - 36.48 |
0.8969 times |
Fri 21 November 2025 |
36.91 (2.02%) |
36.55 |
36.38 - 36.91 |
0.8072 times |
Thu 20 November 2025 |
36.18 (-0.36%) |
36.05 |
36.05 - 36.18 |
0.583 times |
Wed 19 November 2025 |
36.31 (-0.14%) |
36.01 |
36.01 - 36.36 |
0.583 times |
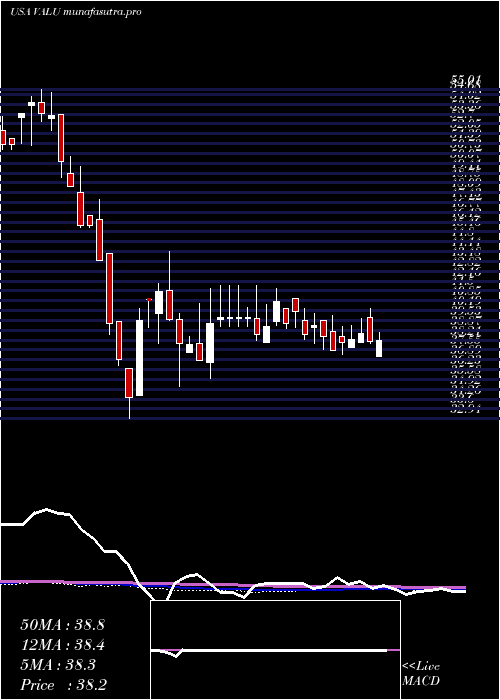
Weekly price and charts ValueLine Strong weekly Stock price targets for ValueLine VALU are 36.53 and 38.89 | Weekly Target 1 | 34.86 | | Weekly Target 2 | 35.84 | | Weekly Target 3 | 37.22 | | Weekly Target 4 | 38.2 | | Weekly Target 5 | 39.58 |
Weekly price and volumes for Value Line
| Date |
Closing |
Open |
Range |
Volume |
Thu 04 December 2025 |
36.82 (-0.78%) |
36.66 |
36.24 - 38.60 |
0.8847 times |
Fri 28 November 2025 |
37.11 (0.54%) |
36.48 |
36.03 - 38.17 |
0.3735 times |
Fri 21 November 2025 |
36.91 (0.3%) |
36.98 |
36.01 - 38.20 |
1.5596 times |
Fri 14 November 2025 |
36.80 (-2.28%) |
38.27 |
36.00 - 38.27 |
0.7077 times |
Fri 07 November 2025 |
37.66 (2.73%) |
36.80 |
36.03 - 37.66 |
0.6225 times |
Fri 31 October 2025 |
36.66 (0%) |
36.80 |
36.66 - 36.80 |
0.0786 times |
Fri 31 October 2025 |
36.66 (-6.62%) |
39.48 |
36.46 - 40.00 |
2.2412 times |
Fri 24 October 2025 |
39.26 (2.11%) |
38.24 |
38.14 - 39.62 |
1.6776 times |
Fri 17 October 2025 |
38.45 (0%) |
39.36 |
38.25 - 40.00 |
0.7929 times |
Fri 10 October 2025 |
38.45 (-1.26%) |
39.59 |
38.45 - 40.12 |
1.0616 times |
Fri 03 October 2025 |
38.94 (-0.15%) |
39.20 |
38.33 - 39.59 |
1.3192 times |
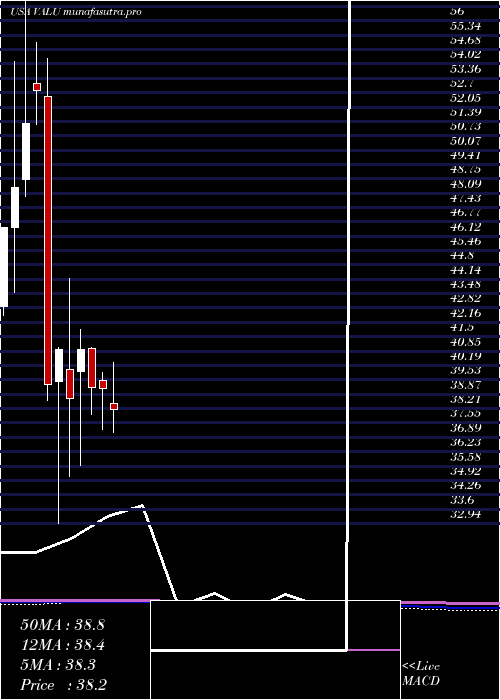
Monthly price and charts ValueLine Strong monthly Stock price targets for ValueLine VALU are 36.53 and 38.89 | Monthly Target 1 | 34.86 | | Monthly Target 2 | 35.84 | | Monthly Target 3 | 37.22 | | Monthly Target 4 | 38.2 | | Monthly Target 5 | 39.58 |
Monthly price and volumes Value Line
| Date |
Closing |
Open |
Range |
Volume |
Thu 04 December 2025 |
36.82 (-0.78%) |
36.66 |
36.24 - 38.60 |
0.1469 times |
Fri 28 November 2025 |
37.11 (1.23%) |
36.80 |
36.00 - 38.27 |
0.5419 times |
Fri 31 October 2025 |
36.66 (-6.19%) |
38.63 |
36.46 - 40.12 |
1.0896 times |
Tue 30 September 2025 |
39.08 (3%) |
37.34 |
36.52 - 39.59 |
1.4223 times |
Fri 29 August 2025 |
37.94 (2.15%) |
37.62 |
36.00 - 39.68 |
1.2873 times |
Thu 31 July 2025 |
37.14 (-5.13%) |
38.42 |
36.62 - 40.50 |
0.6458 times |
Mon 30 June 2025 |
39.15 (-0.1%) |
39.50 |
37.27 - 39.88 |
0.5397 times |
Fri 30 May 2025 |
39.19 (-4.18%) |
40.96 |
37.95 - 41.00 |
0.679 times |
Wed 30 April 2025 |
40.90 (5.77%) |
39.93 |
35.62 - 41.85 |
1.8958 times |
Mon 31 March 2025 |
38.67 (-5.54%) |
40.00 |
35.11 - 44.17 |
1.7516 times |
Fri 28 February 2025 |
40.94 (4.17%) |
39.46 |
32.94 - 41.02 |
1.2667 times |
DMA SMA EMA moving averages of Value Line VALU
DMA (daily moving average) of Value Line VALU
| DMA period | DMA value | | 5 day DMA | 37.11 | | 12 day DMA | 36.81 | | 20 day DMA | 36.82 | | 35 day DMA | 37.27 | | 50 day DMA | 37.79 | | 100 day DMA | 37.99 | | 150 day DMA | 38.29 | | 200 day DMA | 38.6 | EMA (exponential moving average) of Value Line VALU
| EMA period | EMA current | EMA prev | EMA prev2 | | 5 day EMA | 37.17 | 37.35 | 36.72 | | 12 day EMA | 36.99 | 37.02 | 36.73 | | 20 day EMA | 37.03 | 37.05 | 36.89 | | 35 day EMA | 37.34 | 37.37 | 37.3 | | 50 day EMA | 37.75 | 37.79 | 37.76 |
SMA (simple moving average) of Value Line VALU
| SMA period | SMA current | SMA prev | SMA prev2 | | 5 day SMA | 37.11 | 37.16 | 36.9 | | 12 day SMA | 36.81 | 36.77 | 36.62 | | 20 day SMA | 36.82 | 36.78 | 36.69 | | 35 day SMA | 37.27 | 37.33 | 37.34 | | 50 day SMA | 37.79 | 37.81 | 37.79 | | 100 day SMA | 37.99 | 38.01 | 38 | | 150 day SMA | 38.29 | 38.31 | 38.32 | | 200 day SMA | 38.6 | 38.6 | 38.58 |
|
|
