ValeS VALE full analysis,charts,indicators,moving averages,SMA,DMA,EMA,ADX,MACD,RSIVale S VALE WideScreen charts, DMA,SMA,EMA technical analysis, forecast prediction, by indicators ADX,MACD,RSI,CCI USA stock exchange
operates under Basic Industries sector & deals in Precious Metals
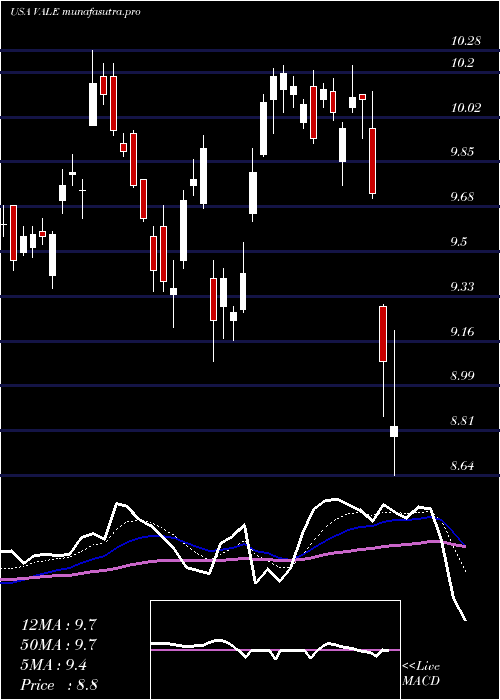
Daily price and charts and targets ValeS Strong Daily Stock price targets for ValeS VALE are 13.42 and 13.78 | Daily Target 1 | 13.12 | | Daily Target 2 | 13.35 | | Daily Target 3 | 13.483333333333 | | Daily Target 4 | 13.71 | | Daily Target 5 | 13.84 |
Daily price and volume Vale S
| Date |
Closing |
Open |
Range |
Volume |
Thu 04 December 2025 |
13.57 (2.03%) |
13.29 |
13.26 - 13.62 |
1.2888 times |
Wed 03 December 2025 |
13.30 (3.1%) |
13.00 |
12.96 - 13.39 |
2.0948 times |
Tue 02 December 2025 |
12.90 (1.65%) |
12.73 |
12.65 - 12.90 |
0.7987 times |
Mon 01 December 2025 |
12.69 (0.63%) |
12.66 |
12.64 - 12.74 |
0.6939 times |
Fri 28 November 2025 |
12.61 (0.8%) |
12.65 |
12.54 - 12.72 |
0.7982 times |
Wed 26 November 2025 |
12.51 (2.63%) |
12.28 |
12.28 - 12.56 |
0.8477 times |
Tue 25 November 2025 |
12.19 (0.83%) |
12.18 |
12.14 - 12.26 |
0.7398 times |
Mon 24 November 2025 |
12.09 (0%) |
12.14 |
12.02 - 12.17 |
0.5337 times |
Fri 21 November 2025 |
12.09 (1.43%) |
12.01 |
11.82 - 12.12 |
1.2765 times |
Thu 20 November 2025 |
11.92 (-1.65%) |
12.22 |
11.89 - 12.27 |
0.9278 times |
Wed 19 November 2025 |
12.12 (-0.41%) |
12.15 |
12.10 - 12.27 |
0.6411 times |
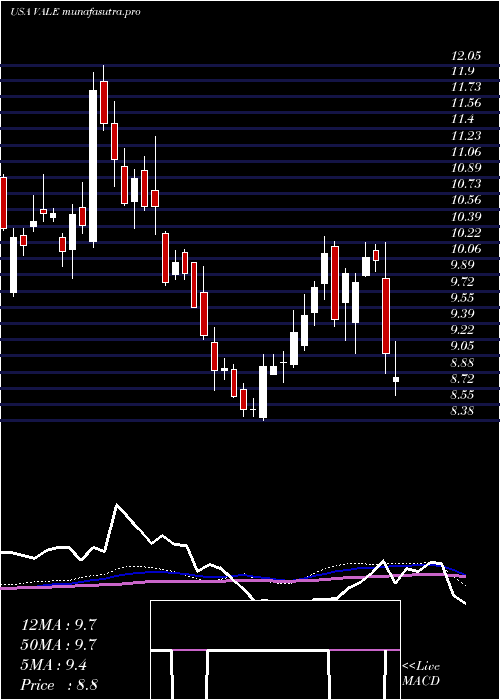
Weekly price and charts ValeS Strong weekly Stock price targets for ValeS VALE are 13.11 and 14.09 | Weekly Target 1 | 12.3 | | Weekly Target 2 | 12.93 | | Weekly Target 3 | 13.276666666667 | | Weekly Target 4 | 13.91 | | Weekly Target 5 | 14.26 |
Weekly price and volumes for Vale S
| Date |
Closing |
Open |
Range |
Volume |
Thu 04 December 2025 |
13.57 (7.61%) |
12.66 |
12.64 - 13.62 |
1.1376 times |
Fri 28 November 2025 |
12.61 (4.3%) |
12.14 |
12.02 - 12.72 |
0.6811 times |
Fri 21 November 2025 |
12.09 (-1.71%) |
12.31 |
11.82 - 12.38 |
1.0298 times |
Fri 14 November 2025 |
12.30 (1.23%) |
12.33 |
12.19 - 12.60 |
0.751 times |
Fri 07 November 2025 |
12.15 (0.5%) |
12.00 |
11.87 - 12.40 |
1.0545 times |
Fri 31 October 2025 |
12.09 (0%) |
11.90 |
11.89 - 12.22 |
0.3184 times |
Fri 31 October 2025 |
12.09 (5.96%) |
11.54 |
11.43 - 12.22 |
1.3634 times |
Fri 24 October 2025 |
11.41 (2.61%) |
11.15 |
11.09 - 11.66 |
1.1088 times |
Fri 17 October 2025 |
11.12 (3.44%) |
10.96 |
10.77 - 11.22 |
1.1085 times |
Fri 10 October 2025 |
10.75 (-2.36%) |
11.09 |
10.71 - 11.33 |
1.4471 times |
Fri 03 October 2025 |
11.01 (2.9%) |
10.82 |
10.72 - 11.09 |
1.0753 times |
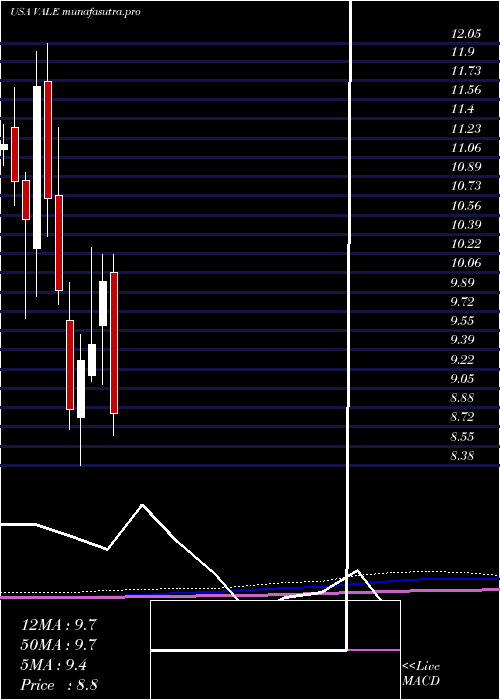
Monthly price and charts ValeS Strong monthly Stock price targets for ValeS VALE are 13.11 and 14.09 | Monthly Target 1 | 12.3 | | Monthly Target 2 | 12.93 | | Monthly Target 3 | 13.276666666667 | | Monthly Target 4 | 13.91 | | Monthly Target 5 | 14.26 |
Monthly price and volumes Vale S
| Date |
Closing |
Open |
Range |
Volume |
Thu 04 December 2025 |
13.57 (7.61%) |
12.66 |
12.64 - 13.62 |
0.2491 times |
Fri 28 November 2025 |
12.61 (4.3%) |
12.00 |
11.82 - 12.72 |
0.77 times |
Fri 31 October 2025 |
12.09 (11.33%) |
10.94 |
10.71 - 12.22 |
1.3096 times |
Tue 30 September 2025 |
10.86 (5.64%) |
10.13 |
10.08 - 11.06 |
0.8939 times |
Fri 29 August 2025 |
10.28 (7.87%) |
9.89 |
9.66 - 10.44 |
0.8589 times |
Thu 31 July 2025 |
9.53 (-1.85%) |
9.70 |
9.36 - 10.46 |
1.7748 times |
Mon 30 June 2025 |
9.71 (6.35%) |
9.24 |
8.97 - 9.77 |
1.2053 times |
Fri 30 May 2025 |
9.13 (-1.93%) |
9.31 |
9.11 - 9.93 |
0.7922 times |
Wed 30 April 2025 |
9.31 (-6.71%) |
10.06 |
8.06 - 10.22 |
1.2645 times |
Mon 31 March 2025 |
9.98 (5.83%) |
9.60 |
9.08 - 10.22 |
0.8817 times |
Fri 28 February 2025 |
9.43 (1.51%) |
9.16 |
9.11 - 10.28 |
0.9575 times |
DMA SMA EMA moving averages of Vale S VALE
DMA (daily moving average) of Vale S VALE
| DMA period | DMA value | | 5 day DMA | 13.01 | | 12 day DMA | 12.51 | | 20 day DMA | 12.43 | | 35 day DMA | 12.09 | | 50 day DMA | 11.75 | | 100 day DMA | 10.98 | | 150 day DMA | 10.51 | | 200 day DMA | 10.26 | EMA (exponential moving average) of Vale S VALE
| EMA period | EMA current | EMA prev | EMA prev2 | | 5 day EMA | 13.09 | 12.85 | 12.62 | | 12 day EMA | 12.71 | 12.55 | 12.41 | | 20 day EMA | 12.48 | 12.36 | 12.26 | | 35 day EMA | 12.12 | 12.03 | 11.96 | | 50 day EMA | 11.8 | 11.73 | 11.67 |
SMA (simple moving average) of Vale S VALE
| SMA period | SMA current | SMA prev | SMA prev2 | | 5 day SMA | 13.01 | 12.8 | 12.58 | | 12 day SMA | 12.51 | 12.4 | 12.31 | | 20 day SMA | 12.43 | 12.36 | 12.3 | | 35 day SMA | 12.09 | 12.02 | 11.95 | | 50 day SMA | 11.75 | 11.7 | 11.65 | | 100 day SMA | 10.98 | 10.94 | 10.91 | | 150 day SMA | 10.51 | 10.48 | 10.46 | | 200 day SMA | 10.26 | 10.25 | 10.23 |
|
|
