UniversalInsurance UVE full analysis,charts,indicators,moving averages,SMA,DMA,EMA,ADX,MACD,RSIUniversal Insurance UVE WideScreen charts, DMA,SMA,EMA technical analysis, forecast prediction, by indicators ADX,MACD,RSI,CCI USA stock exchange
operates under Finance sector & deals in Property Casualty Insurers
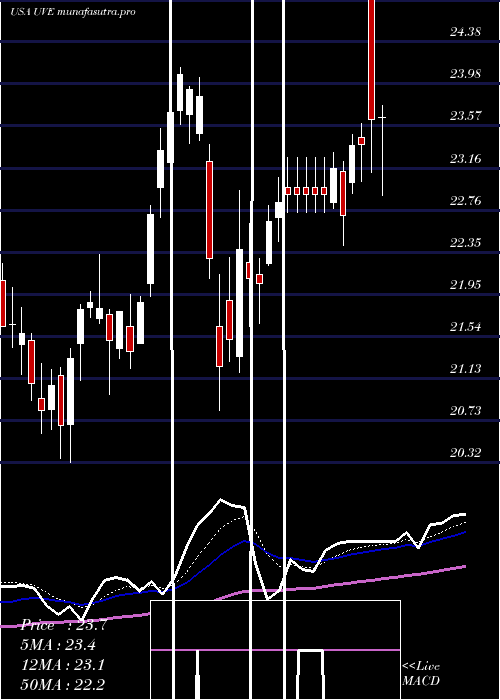
Daily price and charts and targets UniversalInsurance Strong Daily Stock price targets for UniversalInsurance UVE are 31.71 and 32.43 | Daily Target 1 | 31.57 | | Daily Target 2 | 31.84 | | Daily Target 3 | 32.286666666667 | | Daily Target 4 | 32.56 | | Daily Target 5 | 33.01 |
Daily price and volume Universal Insurance
| Date |
Closing |
Open |
Range |
Volume |
Thu 04 December 2025 |
32.12 (-1.53%) |
32.61 |
32.01 - 32.73 |
0.8877 times |
Wed 03 December 2025 |
32.62 (0.03%) |
32.53 |
31.80 - 32.89 |
0.7567 times |
Tue 02 December 2025 |
32.61 (-0.46%) |
33.07 |
32.40 - 33.07 |
0.8156 times |
Mon 01 December 2025 |
32.76 (-1.12%) |
33.14 |
32.73 - 33.58 |
1.1525 times |
Fri 28 November 2025 |
33.13 (-0.66%) |
33.23 |
32.89 - 33.40 |
0.561 times |
Wed 26 November 2025 |
33.35 (0.27%) |
33.42 |
33.20 - 33.60 |
0.7873 times |
Tue 25 November 2025 |
33.26 (-0.21%) |
33.48 |
32.81 - 34.23 |
0.983 times |
Mon 24 November 2025 |
33.33 (-0.09%) |
33.36 |
32.99 - 33.80 |
1.0288 times |
Fri 21 November 2025 |
33.36 (2.36%) |
32.72 |
32.00 - 33.66 |
1.7011 times |
Thu 20 November 2025 |
32.59 (-2.89%) |
33.95 |
32.32 - 34.68 |
1.3264 times |
Wed 19 November 2025 |
33.56 (-0.68%) |
33.90 |
33.11 - 34.00 |
1.1983 times |
Weekly price and charts UniversalInsurance Strong weekly Stock price targets for UniversalInsurance UVE are 31.07 and 32.85 | Weekly Target 1 | 30.72 | | Weekly Target 2 | 31.42 | | Weekly Target 3 | 32.5 | | Weekly Target 4 | 33.2 | | Weekly Target 5 | 34.28 |
Weekly price and volumes for Universal Insurance
| Date |
Closing |
Open |
Range |
Volume |
Thu 04 December 2025 |
32.12 (-3.05%) |
33.14 |
31.80 - 33.58 |
0.6391 times |
Fri 28 November 2025 |
33.13 (-0.69%) |
33.36 |
32.81 - 34.23 |
0.5945 times |
Fri 21 November 2025 |
33.36 (-3.02%) |
34.62 |
32.00 - 35.15 |
1.1092 times |
Fri 14 November 2025 |
34.40 (2.35%) |
33.72 |
33.60 - 35.84 |
1.2214 times |
Fri 07 November 2025 |
33.61 (9.05%) |
31.02 |
31.00 - 33.65 |
1.1629 times |
Fri 31 October 2025 |
30.82 (0%) |
31.38 |
30.68 - 31.67 |
0.1861 times |
Fri 31 October 2025 |
30.82 (-3.87%) |
32.25 |
30.57 - 33.00 |
1.5201 times |
Fri 24 October 2025 |
32.06 (14.13%) |
28.21 |
27.90 - 32.42 |
1.1358 times |
Fri 17 October 2025 |
28.09 (-3.27%) |
29.47 |
27.89 - 30.02 |
1.1817 times |
Fri 10 October 2025 |
29.04 (2.36%) |
28.36 |
28.23 - 30.48 |
1.2491 times |
Fri 03 October 2025 |
28.37 (8.66%) |
26.07 |
25.58 - 28.61 |
1.1719 times |
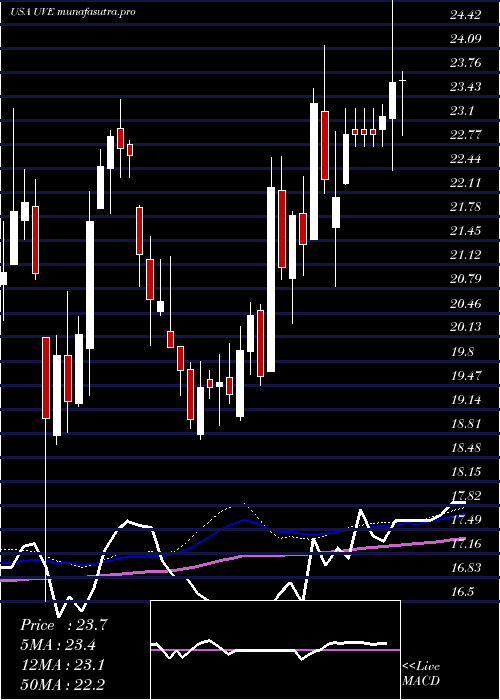
Monthly price and charts UniversalInsurance Strong monthly Stock price targets for UniversalInsurance UVE are 31.07 and 32.85 | Monthly Target 1 | 30.72 | | Monthly Target 2 | 31.42 | | Monthly Target 3 | 32.5 | | Monthly Target 4 | 33.2 | | Monthly Target 5 | 34.28 |
Monthly price and volumes Universal Insurance
| Date |
Closing |
Open |
Range |
Volume |
Thu 04 December 2025 |
32.12 (-3.05%) |
33.14 |
31.80 - 33.58 |
0.1239 times |
Fri 28 November 2025 |
33.13 (7.5%) |
31.02 |
31.00 - 35.84 |
0.7923 times |
Fri 31 October 2025 |
30.82 (17.19%) |
26.22 |
25.58 - 33.00 |
1.1508 times |
Tue 30 September 2025 |
26.30 (7.83%) |
24.30 |
24.09 - 26.32 |
0.8725 times |
Fri 29 August 2025 |
24.39 (3.17%) |
23.38 |
22.87 - 25.00 |
0.8345 times |
Thu 31 July 2025 |
23.64 (-14.75%) |
27.53 |
21.96 - 27.86 |
1.6368 times |
Mon 30 June 2025 |
27.73 (2.17%) |
27.07 |
26.06 - 28.49 |
1.2738 times |
Fri 30 May 2025 |
27.14 (11.96%) |
24.09 |
23.81 - 27.25 |
1.3605 times |
Wed 30 April 2025 |
24.24 (2.28%) |
23.72 |
20.83 - 25.64 |
1.023 times |
Mon 31 March 2025 |
23.70 (6.85%) |
22.14 |
20.32 - 24.04 |
0.9319 times |
Fri 28 February 2025 |
22.18 (14.68%) |
19.04 |
18.99 - 22.59 |
0.7771 times |

DMA SMA EMA moving averages of Universal Insurance UVE
DMA (daily moving average) of Universal Insurance UVE
| DMA period | DMA value | | 5 day DMA | 32.65 | | 12 day DMA | 33.04 | | 20 day DMA | 33.51 | | 35 day DMA | 32.14 | | 50 day DMA | 30.93 | | 100 day DMA | 27.72 | | 150 day DMA | 27.23 | | 200 day DMA | 25.99 | EMA (exponential moving average) of Universal Insurance UVE
| EMA period | EMA current | EMA prev | EMA prev2 | | 5 day EMA | 32.59 | 32.83 | 32.94 | | 12 day EMA | 32.91 | 33.05 | 33.13 | | 20 day EMA | 32.76 | 32.83 | 32.85 | | 35 day EMA | 31.85 | 31.83 | 31.78 | | 50 day EMA | 30.66 | 30.6 | 30.52 |
SMA (simple moving average) of Universal Insurance UVE
| SMA period | SMA current | SMA prev | SMA prev2 | | 5 day SMA | 32.65 | 32.89 | 33.02 | | 12 day SMA | 33.04 | 33.21 | 33.36 | | 20 day SMA | 33.51 | 33.54 | 33.52 | | 35 day SMA | 32.14 | 32.06 | 31.98 | | 50 day SMA | 30.93 | 30.79 | 30.65 | | 100 day SMA | 27.72 | 27.64 | 27.56 | | 150 day SMA | 27.23 | 27.18 | 27.13 | | 200 day SMA | 25.99 | 25.93 | 25.87 |
|
|
