UtahMedical UTMD full analysis,charts,indicators,moving averages,SMA,DMA,EMA,ADX,MACD,RSIUtah Medical UTMD WideScreen charts, DMA,SMA,EMA technical analysis, forecast prediction, by indicators ADX,MACD,RSI,CCI USA stock exchange
operates under Health Care sector & deals in Medical Dental Instruments
Daily price and charts and targets UtahMedical Strong Daily Stock price targets for UtahMedical UTMD are 55.5 and 56.87 | Daily Target 1 | 54.42 | | Daily Target 2 | 55.2 | | Daily Target 3 | 55.786666666667 | | Daily Target 4 | 56.57 | | Daily Target 5 | 57.16 |
Daily price and volume Utah Medical
| Date |
Closing |
Open |
Range |
Volume |
Thu 04 December 2025 |
55.99 (0.65%) |
55.40 |
55.00 - 56.37 |
1.2558 times |
Wed 03 December 2025 |
55.63 (1.37%) |
55.04 |
54.60 - 55.63 |
1.2625 times |
Tue 02 December 2025 |
54.88 (-0.51%) |
55.89 |
54.80 - 55.91 |
1.316 times |
Mon 01 December 2025 |
55.16 (-2.11%) |
56.26 |
55.01 - 56.26 |
0.8951 times |
Fri 28 November 2025 |
56.35 (1.22%) |
54.93 |
54.55 - 56.35 |
0.6279 times |
Wed 26 November 2025 |
55.67 (-0.46%) |
55.50 |
54.76 - 55.88 |
1.0154 times |
Tue 25 November 2025 |
55.93 (1.29%) |
54.10 |
54.10 - 55.98 |
0.9419 times |
Mon 24 November 2025 |
55.22 (0.11%) |
55.60 |
53.80 - 55.73 |
0.7214 times |
Fri 21 November 2025 |
55.16 (2.53%) |
53.84 |
53.84 - 55.34 |
1.0688 times |
Thu 20 November 2025 |
53.80 (-0.19%) |
53.80 |
53.66 - 54.39 |
0.8951 times |
Wed 19 November 2025 |
53.90 (-1.34%) |
54.31 |
53.75 - 54.56 |
0.815 times |

Weekly price and charts UtahMedical Strong weekly Stock price targets for UtahMedical UTMD are 54.41 and 56.18 | Weekly Target 1 | 53.88 | | Weekly Target 2 | 54.94 | | Weekly Target 3 | 55.653333333333 | | Weekly Target 4 | 56.71 | | Weekly Target 5 | 57.42 |
Weekly price and volumes for Utah Medical
| Date |
Closing |
Open |
Range |
Volume |
Thu 04 December 2025 |
55.99 (-0.64%) |
56.26 |
54.60 - 56.37 |
1.6488 times |
Fri 28 November 2025 |
56.35 (2.16%) |
55.60 |
53.80 - 56.35 |
1.1528 times |
Fri 21 November 2025 |
55.16 (-0.4%) |
55.20 |
53.66 - 55.98 |
1.4788 times |
Fri 14 November 2025 |
55.38 (-3.52%) |
57.81 |
54.79 - 58.15 |
1.3414 times |
Fri 07 November 2025 |
57.40 (-1.2%) |
57.17 |
56.71 - 58.76 |
0.8454 times |
Fri 31 October 2025 |
58.10 (0%) |
56.84 |
56.34 - 59.39 |
0.2166 times |
Fri 31 October 2025 |
58.10 (-3.86%) |
60.35 |
55.65 - 60.70 |
1.013 times |
Fri 24 October 2025 |
60.43 (1.67%) |
59.35 |
59.35 - 61.81 |
0.7126 times |
Fri 17 October 2025 |
59.44 (-3.08%) |
63.15 |
59.34 - 63.36 |
0.7336 times |
Fri 10 October 2025 |
61.33 (-3.11%) |
63.22 |
61.33 - 64.46 |
0.857 times |
Fri 03 October 2025 |
63.30 (0.78%) |
62.63 |
62.26 - 64.22 |
0.8179 times |
Monthly price and charts UtahMedical Strong monthly Stock price targets for UtahMedical UTMD are 54.41 and 56.18 | Monthly Target 1 | 53.88 | | Monthly Target 2 | 54.94 | | Monthly Target 3 | 55.653333333333 | | Monthly Target 4 | 56.71 | | Monthly Target 5 | 57.42 |
Monthly price and volumes Utah Medical
| Date |
Closing |
Open |
Range |
Volume |
Thu 04 December 2025 |
55.99 (-0.64%) |
56.26 |
54.60 - 56.37 |
0.2709 times |
Fri 28 November 2025 |
56.35 (-3.01%) |
57.17 |
53.66 - 58.76 |
0.7916 times |
Fri 31 October 2025 |
58.10 (-7.73%) |
62.94 |
55.65 - 64.46 |
0.644 times |
Tue 30 September 2025 |
62.97 (1.22%) |
61.47 |
60.49 - 64.22 |
0.6512 times |
Fri 29 August 2025 |
62.21 (11.89%) |
55.25 |
54.60 - 63.10 |
1.113 times |
Thu 31 July 2025 |
55.60 (-2.32%) |
56.60 |
55.21 - 59.49 |
1.164 times |
Mon 30 June 2025 |
56.92 (3.34%) |
55.05 |
52.00 - 57.99 |
1.5385 times |
Fri 30 May 2025 |
55.08 (6.43%) |
51.75 |
51.75 - 55.84 |
1.0124 times |
Wed 30 April 2025 |
51.75 (-7.66%) |
56.00 |
51.26 - 56.95 |
1.5011 times |
Mon 31 March 2025 |
56.04 (-5.99%) |
59.60 |
55.81 - 60.46 |
1.3131 times |
Fri 28 February 2025 |
59.61 (-2.65%) |
60.77 |
58.87 - 62.52 |
1.6904 times |
DMA SMA EMA moving averages of Utah Medical UTMD
DMA (daily moving average) of Utah Medical UTMD
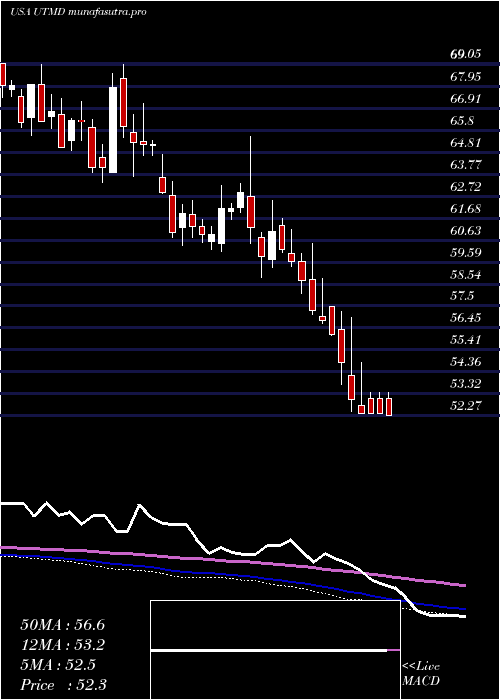
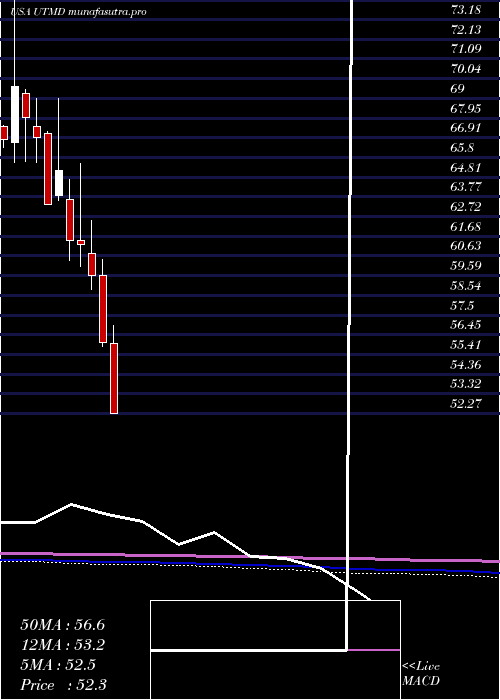
| DMA period | DMA value | | 5 day DMA | 55.6 | | 12 day DMA | 55.19 | | 20 day DMA | 55.74 | | 35 day DMA | 57.18 | | 50 day DMA | 58.76 | | 100 day DMA | 59.07 | | 150 day DMA | 57.82 | | 200 day DMA | 57.41 | EMA (exponential moving average) of Utah Medical UTMD
| EMA period | EMA current | EMA prev | EMA prev2 | | 5 day EMA | 55.61 | 55.42 | 55.31 | | 12 day EMA | 55.62 | 55.55 | 55.54 | | 20 day EMA | 56.07 | 56.08 | 56.13 | | 35 day EMA | 57.34 | 57.42 | 57.53 | | 50 day EMA | 58.79 | 58.9 | 59.03 |
SMA (simple moving average) of Utah Medical UTMD
| SMA period | SMA current | SMA prev | SMA prev2 | | 5 day SMA | 55.6 | 55.54 | 55.6 | | 12 day SMA | 55.19 | 55.11 | 55.08 | | 20 day SMA | 55.74 | 55.84 | 55.97 | | 35 day SMA | 57.18 | 57.3 | 57.43 | | 50 day SMA | 58.76 | 58.89 | 59.04 | | 100 day SMA | 59.07 | 59.07 | 59.08 | | 150 day SMA | 57.82 | 57.79 | 57.77 | | 200 day SMA | 57.41 | 57.43 | 57.46 |
|
|
