UnitedTherapeutics UTHR full analysis,charts,indicators,moving averages,SMA,DMA,EMA,ADX,MACD,RSIUnited Therapeutics UTHR WideScreen charts, DMA,SMA,EMA technical analysis, forecast prediction, by indicators ADX,MACD,RSI,CCI USA stock exchange
operates under Health Care sector & deals in Major Pharmaceuticals
Daily price and charts and targets UnitedTherapeutics Strong Daily Stock price targets for UnitedTherapeutics UTHR are 417.68 and 427.37 | Daily Target 1 | 416.06 | | Daily Target 2 | 419.29 | | Daily Target 3 | 425.74666666667 | | Daily Target 4 | 428.98 | | Daily Target 5 | 435.44 |
Daily price and volume United Therapeutics
| Date |
Closing |
Open |
Range |
Volume |
Tue 21 October 2025 |
422.53 (-2.35%) |
432.20 |
422.51 - 432.20 |
0.7873 times |
Mon 20 October 2025 |
432.69 (-0.15%) |
434.22 |
419.54 - 436.00 |
1.1345 times |
Fri 17 October 2025 |
433.34 (0.15%) |
432.23 |
428.04 - 435.38 |
0.9227 times |
Thu 16 October 2025 |
432.69 (0.12%) |
430.13 |
427.86 - 435.36 |
0.8724 times |
Wed 15 October 2025 |
432.19 (-0.33%) |
433.42 |
429.84 - 441.78 |
1.1588 times |
Tue 14 October 2025 |
433.61 (-1.47%) |
437.53 |
430.80 - 442.23 |
1.1704 times |
Mon 13 October 2025 |
440.06 (0.01%) |
437.53 |
430.89 - 443.11 |
0.778 times |
Fri 10 October 2025 |
440.00 (-1.21%) |
445.66 |
439.18 - 446.16 |
1.2151 times |
Thu 09 October 2025 |
445.38 (-0.79%) |
449.83 |
444.05 - 452.70 |
1.0094 times |
Wed 08 October 2025 |
448.93 (-1.73%) |
456.52 |
444.00 - 456.52 |
0.9514 times |
Tue 07 October 2025 |
456.84 (0.79%) |
450.31 |
449.51 - 459.48 |
1.0742 times |
Weekly price and charts UnitedTherapeutics Strong weekly Stock price targets for UnitedTherapeutics UTHR are 412.81 and 429.27 | Weekly Target 1 | 409.56 | | Weekly Target 2 | 416.05 | | Weekly Target 3 | 426.02333333333 | | Weekly Target 4 | 432.51 | | Weekly Target 5 | 442.48 |
Weekly price and volumes for United Therapeutics
| Date |
Closing |
Open |
Range |
Volume |
Tue 21 October 2025 |
422.53 (-2.49%) |
434.22 |
419.54 - 436.00 |
0.3083 times |
Fri 17 October 2025 |
433.34 (-1.51%) |
437.53 |
427.86 - 443.11 |
0.7865 times |
Fri 10 October 2025 |
440.00 (-2.88%) |
445.24 |
439.18 - 459.48 |
0.8773 times |
Fri 03 October 2025 |
453.07 (4.72%) |
429.18 |
415.00 - 455.12 |
1.2556 times |
Fri 26 September 2025 |
432.66 (3.61%) |
419.47 |
412.96 - 442.01 |
1.2828 times |
Fri 19 September 2025 |
417.57 (3.1%) |
400.08 |
396.12 - 419.26 |
1.3368 times |
Fri 12 September 2025 |
405.02 (1.12%) |
398.93 |
388.73 - 407.06 |
0.9669 times |
Fri 05 September 2025 |
400.52 (31.42%) |
419.63 |
375.61 - 436.95 |
2.0185 times |
Fri 29 August 2025 |
304.76 (0%) |
307.16 |
303.09 - 307.99 |
0.1182 times |
Fri 29 August 2025 |
304.76 (-2.39%) |
310.72 |
302.19 - 312.65 |
1.0491 times |
Fri 22 August 2025 |
312.23 (-0.29%) |
314.03 |
303.59 - 317.31 |
0.8621 times |
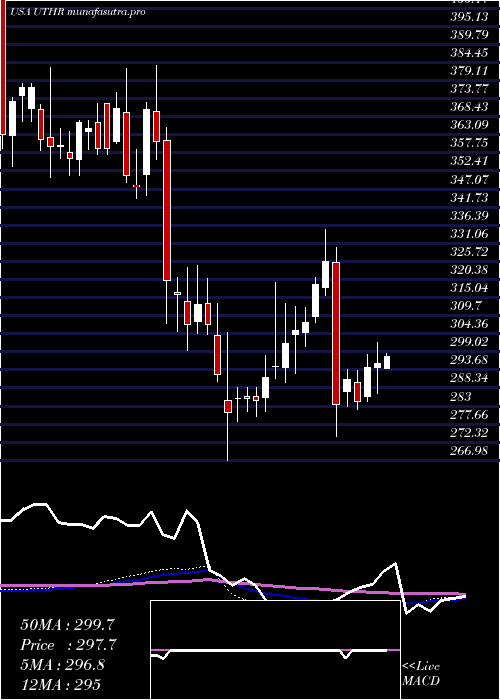
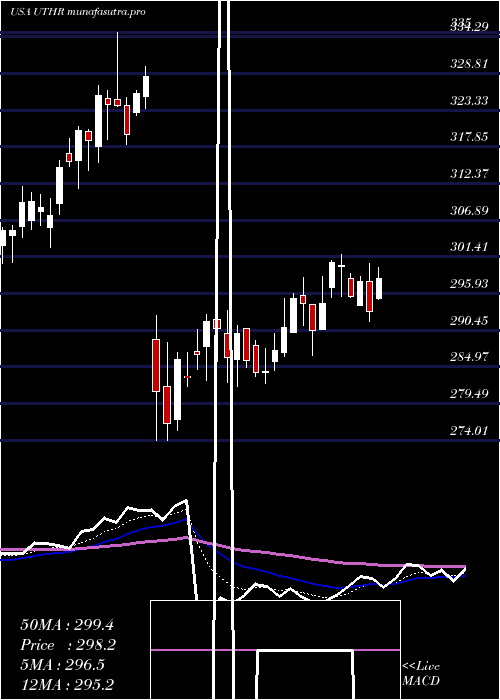
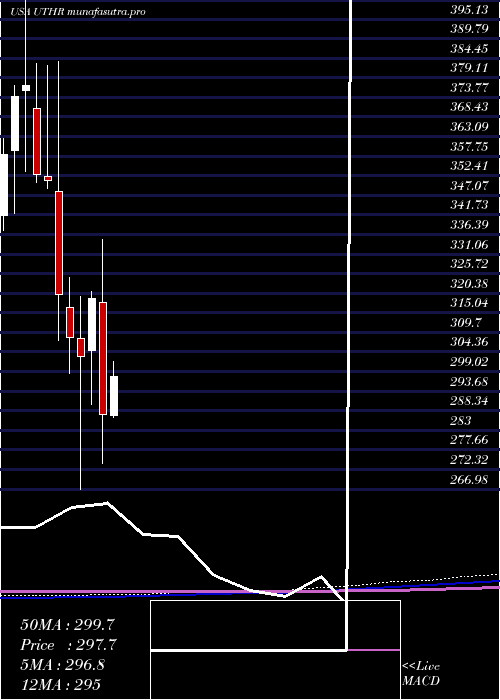
Monthly price and charts UnitedTherapeutics Strong monthly Stock price targets for UnitedTherapeutics UTHR are 420.87 and 461.14 | Monthly Target 1 | 393.47 | | Monthly Target 2 | 408 | | Monthly Target 3 | 433.74 | | Monthly Target 4 | 448.27 | | Monthly Target 5 | 474.01 |
Monthly price and volumes United Therapeutics
| Date |
Closing |
Open |
Range |
Volume |
Tue 21 October 2025 |
422.53 (0.79%) |
421.26 |
419.21 - 459.48 |
0.7927 times |
Tue 30 September 2025 |
419.21 (37.55%) |
419.63 |
375.61 - 442.01 |
1.8966 times |
Fri 29 August 2025 |
304.76 (10.94%) |
284.65 |
283.01 - 317.31 |
1.3609 times |
Thu 31 July 2025 |
274.70 (-4.4%) |
287.15 |
272.12 - 307.71 |
0.8115 times |
Mon 30 June 2025 |
287.35 (-9.88%) |
317.93 |
274.01 - 335.00 |
1.198 times |
Fri 30 May 2025 |
318.85 (5.2%) |
304.79 |
290.02 - 320.91 |
0.8573 times |
Wed 30 April 2025 |
303.09 (-1.68%) |
308.17 |
266.98 - 319.40 |
0.7963 times |
Mon 31 March 2025 |
308.27 (-3.68%) |
316.46 |
298.60 - 324.57 |
0.8282 times |
Fri 28 February 2025 |
320.05 (-8.86%) |
348.17 |
307.38 - 383.51 |
0.9173 times |
Fri 31 January 2025 |
351.17 (-0.47%) |
352.33 |
349.07 - 382.61 |
0.5412 times |
Tue 31 December 2024 |
352.84 (-6.41%) |
370.69 |
350.60 - 383.00 |
0.4071 times |
DMA SMA EMA moving averages of United Therapeutics UTHR
DMA (daily moving average) of United Therapeutics UTHR
| DMA period | DMA value | | 5 day DMA | 430.69 | | 12 day DMA | 439.3 | | 20 day DMA | 437.33 | | 35 day DMA | 422.99 | | 50 day DMA | 390.76 | | 100 day DMA | 344.44 | | 150 day DMA | 329.9 | | 200 day DMA | 335.06 | EMA (exponential moving average) of United Therapeutics UTHR
| EMA period | EMA current | EMA prev | EMA prev2 | | 5 day EMA | 430.35 | 434.26 | 435.04 | | 12 day EMA | 433.66 | 435.68 | 436.22 | | 20 day EMA | 429.5 | 430.23 | 429.97 | | 35 day EMA | 409.64 | 408.88 | 407.48 | | 50 day EMA | 387.35 | 385.91 | 384 |
SMA (simple moving average) of United Therapeutics UTHR
| SMA period | SMA current | SMA prev | SMA prev2 | | 5 day SMA | 430.69 | 432.9 | 434.38 | | 12 day SMA | 439.3 | 441.84 | 442.74 | | 20 day SMA | 437.33 | 437.91 | 437.01 | | 35 day SMA | 422.99 | 422.49 | 418.83 | | 50 day SMA | 390.76 | 388.34 | 385.69 | | 100 day SMA | 344.44 | 343.37 | 342.19 | | 150 day SMA | 329.9 | 329.12 | 328.28 | | 200 day SMA | 335.06 | 334.71 | 334.34 |
|
|
