UsanaHealth USNA full analysis,charts,indicators,moving averages,SMA,DMA,EMA,ADX,MACD,RSIUsana Health USNA WideScreen charts, DMA,SMA,EMA technical analysis, forecast prediction, by indicators ADX,MACD,RSI,CCI USA stock exchange
operates under Consumer Durables sector & deals in Specialty Chemicals
Daily price and charts and targets UsanaHealth Strong Daily Stock price targets for UsanaHealth USNA are 20.24 and 21.05 | Daily Target 1 | 20.09 | | Daily Target 2 | 20.39 | | Daily Target 3 | 20.903333333333 | | Daily Target 4 | 21.2 | | Daily Target 5 | 21.71 |
Daily price and volume Usana Health
| Date |
Closing |
Open |
Range |
Volume |
Mon 20 October 2025 |
20.68 (-1.01%) |
21.03 |
20.61 - 21.42 |
1.3232 times |
Fri 17 October 2025 |
20.89 (-0.85%) |
20.88 |
20.74 - 21.27 |
1.0831 times |
Thu 16 October 2025 |
21.07 (2.73%) |
20.56 |
20.56 - 21.38 |
1.4904 times |
Wed 15 October 2025 |
20.51 (-3.3%) |
21.40 |
20.33 - 21.46 |
1.0726 times |
Tue 14 October 2025 |
21.21 (3.31%) |
20.27 |
20.19 - 21.23 |
1.403 times |
Mon 13 October 2025 |
20.53 (-22.03%) |
20.30 |
19.88 - 20.63 |
1.7564 times |
Tue 07 October 2025 |
26.33 (-0.94%) |
26.44 |
26.19 - 26.76 |
0.7112 times |
Mon 06 October 2025 |
26.58 (-2.14%) |
27.17 |
26.57 - 27.25 |
0.3435 times |
Fri 03 October 2025 |
27.16 (-1.02%) |
27.44 |
27.03 - 27.95 |
0.5321 times |
Thu 02 October 2025 |
27.44 (0.62%) |
27.20 |
26.88 - 27.45 |
0.2845 times |
Wed 01 October 2025 |
27.27 (-1.02%) |
27.43 |
27.05 - 27.69 |
0.6429 times |
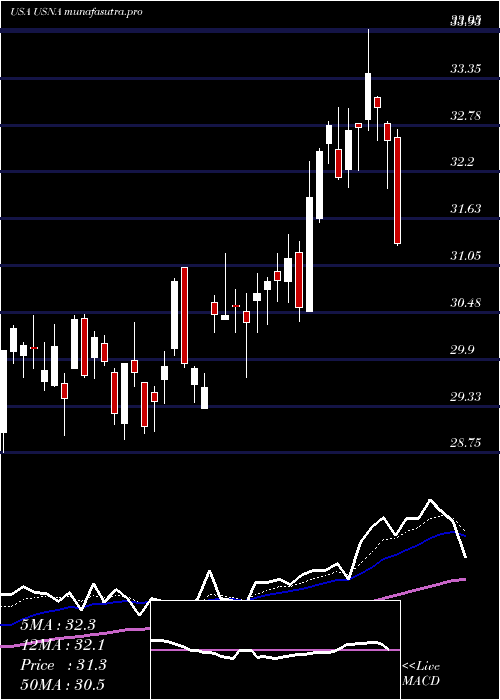
Weekly price and charts UsanaHealth Strong weekly Stock price targets for UsanaHealth USNA are 20.24 and 21.05 | Weekly Target 1 | 20.09 | | Weekly Target 2 | 20.39 | | Weekly Target 3 | 20.903333333333 | | Weekly Target 4 | 21.2 | | Weekly Target 5 | 21.71 |
Weekly price and volumes for Usana Health
| Date |
Closing |
Open |
Range |
Volume |
Mon 20 October 2025 |
20.68 (-1.01%) |
21.03 |
20.61 - 21.42 |
0.4661 times |
Fri 17 October 2025 |
20.89 (-20.66%) |
20.30 |
19.88 - 21.46 |
2.3974 times |
Tue 07 October 2025 |
26.33 (-3.06%) |
27.17 |
26.19 - 27.25 |
0.3716 times |
Fri 03 October 2025 |
27.16 (-4.8%) |
28.52 |
26.88 - 28.52 |
0.9602 times |
Fri 26 September 2025 |
28.53 (-4.07%) |
29.74 |
28.15 - 30.10 |
1.1225 times |
Fri 19 September 2025 |
29.74 (-2.52%) |
30.60 |
29.53 - 31.15 |
1.5271 times |
Fri 12 September 2025 |
30.51 (-4.12%) |
31.76 |
29.67 - 31.79 |
1.3183 times |
Fri 05 September 2025 |
31.82 (-0.28%) |
31.68 |
30.95 - 32.29 |
0.9103 times |
Fri 29 August 2025 |
31.91 (0%) |
31.46 |
31.46 - 31.96 |
0.1357 times |
Fri 29 August 2025 |
31.91 (-1.02%) |
32.02 |
31.38 - 32.25 |
0.7909 times |
Fri 22 August 2025 |
32.24 (6.05%) |
30.40 |
30.18 - 32.32 |
0.8232 times |
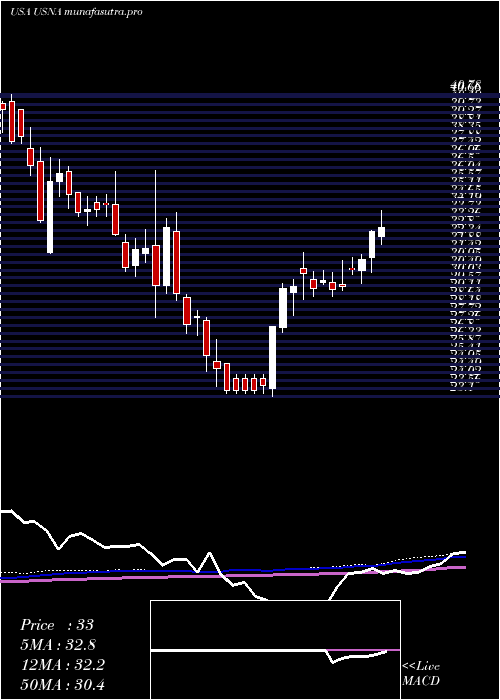
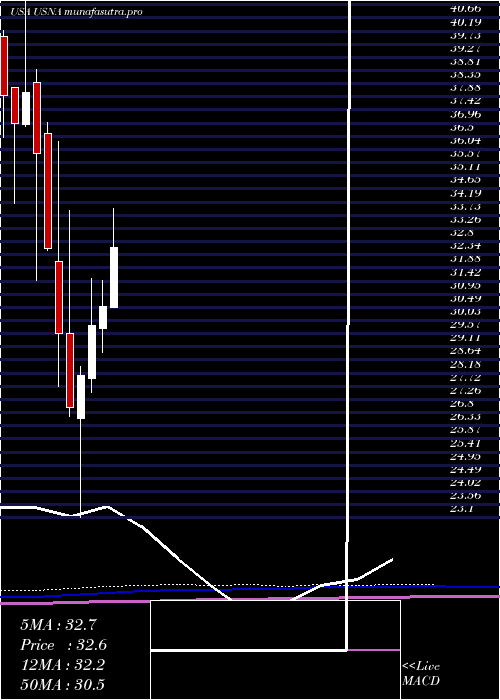
Monthly price and charts UsanaHealth Strong monthly Stock price targets for UsanaHealth USNA are 16.25 and 24.32 | Monthly Target 1 | 14.77 | | Monthly Target 2 | 17.72 | | Monthly Target 3 | 22.836666666667 | | Monthly Target 4 | 25.79 | | Monthly Target 5 | 30.91 |
Monthly price and volumes Usana Health
| Date |
Closing |
Open |
Range |
Volume |
Mon 20 October 2025 |
20.68 (-24.94%) |
27.43 |
19.88 - 27.95 |
0.6477 times |
Tue 30 September 2025 |
27.55 (-13.66%) |
31.68 |
27.25 - 32.29 |
0.9197 times |
Fri 29 August 2025 |
31.91 (8.57%) |
29.19 |
28.45 - 32.32 |
0.6406 times |
Thu 31 July 2025 |
29.39 (-3.73%) |
30.49 |
28.89 - 38.32 |
0.9098 times |
Mon 30 June 2025 |
30.53 (2.21%) |
29.74 |
28.92 - 31.43 |
0.9402 times |
Fri 30 May 2025 |
29.87 (6.34%) |
27.98 |
27.50 - 31.49 |
1.2102 times |
Wed 30 April 2025 |
28.09 (4.15%) |
26.58 |
23.10 - 28.41 |
1.2963 times |
Mon 31 March 2025 |
26.97 (-8.85%) |
29.56 |
26.64 - 33.88 |
1.4028 times |
Fri 28 February 2025 |
29.59 (-9.15%) |
32.11 |
27.71 - 36.33 |
1.2303 times |
Fri 31 January 2025 |
32.57 (-9.25%) |
36.59 |
32.50 - 36.99 |
0.8025 times |
Tue 31 December 2024 |
35.89 (-5.65%) |
38.38 |
31.44 - 38.84 |
0.6671 times |
DMA SMA EMA moving averages of Usana Health USNA
DMA (daily moving average) of Usana Health USNA
| DMA period | DMA value | | 5 day DMA | 20.87 | | 12 day DMA | 23.94 | | 20 day DMA | 26 | | 35 day DMA | 28.16 | | 50 day DMA | 28.92 | | 100 day DMA | 29.84 | | 150 day DMA | 28.91 | | 200 day DMA | 29.9 | EMA (exponential moving average) of Usana Health USNA
| EMA period | EMA current | EMA prev | EMA prev2 | | 5 day EMA | 21.35 | 21.68 | 22.07 | | 12 day EMA | 23.37 | 23.86 | 24.4 | | 20 day EMA | 25.01 | 25.47 | 25.95 | | 35 day EMA | 26.72 | 27.08 | 27.44 | | 50 day EMA | 28.14 | 28.44 | 28.75 |
SMA (simple moving average) of Usana Health USNA
| SMA period | SMA current | SMA prev | SMA prev2 | | 5 day SMA | 20.87 | 20.84 | 21.93 | | 12 day SMA | 23.94 | 24.52 | 25.15 | | 20 day SMA | 26 | 26.47 | 26.95 | | 35 day SMA | 28.16 | 28.48 | 28.79 | | 50 day SMA | 28.92 | 29.08 | 29.24 | | 100 day SMA | 29.84 | 29.93 | 30.03 | | 150 day SMA | 28.91 | 28.99 | 29.07 | | 200 day SMA | 29.9 | 29.97 | 30.05 |
|
|
