US USEG full analysis,charts,indicators,moving averages,SMA,DMA,EMA,ADX,MACD,RSIU S USEG WideScreen charts, DMA,SMA,EMA technical analysis, forecast prediction, by indicators ADX,MACD,RSI,CCI USA stock exchange
operates under Energy sector & deals in Oil Gas Production
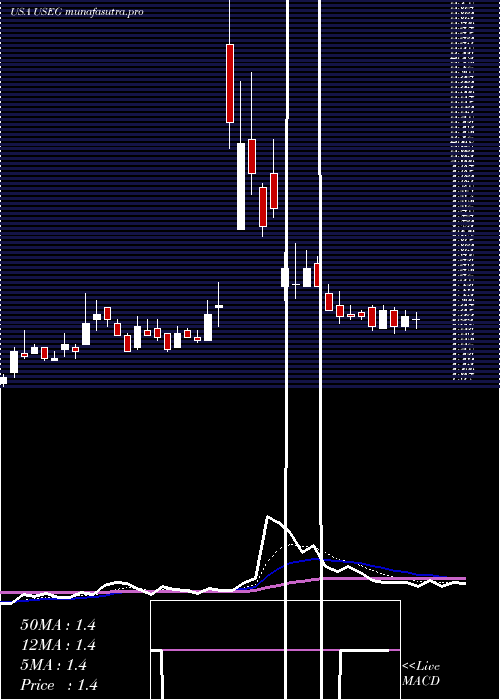
Daily price and charts and targets US Strong Daily Stock price targets for US USEG are 1.17 and 1.2 | Daily Target 1 | 1.16 | | Daily Target 2 | 1.18 | | Daily Target 3 | 1.1933333333333 | | Daily Target 4 | 1.21 | | Daily Target 5 | 1.22 |
Daily price and volume U S
| Date |
Closing |
Open |
Range |
Volume |
Tue 21 October 2025 |
1.19 (-0.83%) |
1.20 |
1.18 - 1.21 |
0.4961 times |
Mon 20 October 2025 |
1.20 (0.84%) |
1.17 |
1.17 - 1.22 |
0.6764 times |
Fri 17 October 2025 |
1.19 (0%) |
1.18 |
1.13 - 1.19 |
0.5804 times |
Thu 16 October 2025 |
1.19 (-2.46%) |
1.23 |
1.18 - 1.23 |
1.1999 times |
Wed 15 October 2025 |
1.22 (7.02%) |
1.16 |
1.16 - 1.26 |
2.4116 times |
Tue 14 October 2025 |
1.14 (0%) |
1.12 |
1.11 - 1.16 |
1.2749 times |
Mon 13 October 2025 |
1.14 (2.7%) |
1.12 |
1.10 - 1.15 |
0.7438 times |
Fri 10 October 2025 |
1.11 (-7.5%) |
1.19 |
1.11 - 1.20 |
1.4828 times |
Thu 09 October 2025 |
1.20 (-0.83%) |
1.22 |
1.20 - 1.23 |
0.6046 times |
Wed 08 October 2025 |
1.21 (-0.82%) |
1.22 |
1.20 - 1.24 |
0.5294 times |
Tue 07 October 2025 |
1.22 (0.83%) |
1.23 |
1.20 - 1.25 |
0.5987 times |
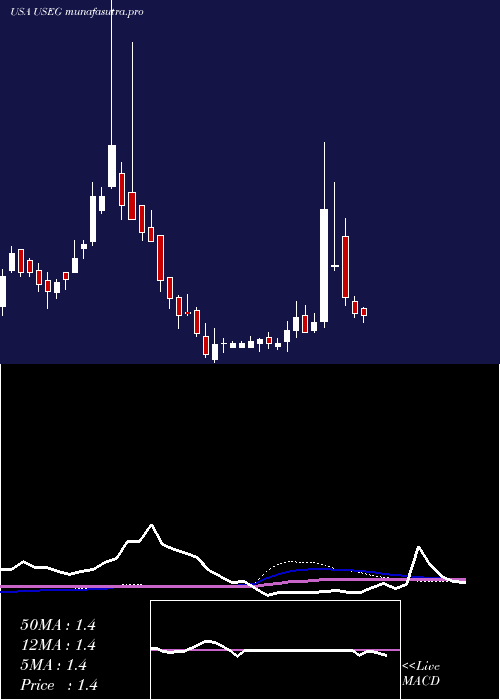
Weekly price and charts US Strong weekly Stock price targets for US USEG are 1.18 and 1.23 | Weekly Target 1 | 1.14 | | Weekly Target 2 | 1.17 | | Weekly Target 3 | 1.1933333333333 | | Weekly Target 4 | 1.22 | | Weekly Target 5 | 1.24 |
Weekly price and volumes for U S
| Date |
Closing |
Open |
Range |
Volume |
Tue 21 October 2025 |
1.19 (0%) |
1.17 |
1.17 - 1.22 |
0.3629 times |
Fri 17 October 2025 |
1.19 (7.21%) |
1.12 |
1.10 - 1.26 |
1.9221 times |
Fri 10 October 2025 |
1.11 (-8.26%) |
1.20 |
1.11 - 1.26 |
1.2217 times |
Fri 03 October 2025 |
1.21 (-2.42%) |
1.24 |
1.17 - 1.24 |
0.8149 times |
Fri 26 September 2025 |
1.24 (6.9%) |
1.16 |
1.16 - 1.32 |
2.3923 times |
Fri 19 September 2025 |
1.16 (0.87%) |
1.15 |
1.14 - 1.22 |
0.8404 times |
Fri 12 September 2025 |
1.15 (3.6%) |
1.12 |
1.10 - 1.19 |
0.8997 times |
Fri 05 September 2025 |
1.11 (-6.72%) |
1.19 |
1.10 - 1.20 |
0.6478 times |
Fri 29 August 2025 |
1.19 (0%) |
1.19 |
1.18 - 1.22 |
0.0761 times |
Fri 29 August 2025 |
1.19 (1.71%) |
1.18 |
1.17 - 1.24 |
0.8222 times |
Fri 22 August 2025 |
1.17 (-3.31%) |
1.18 |
1.16 - 1.21 |
0.6628 times |
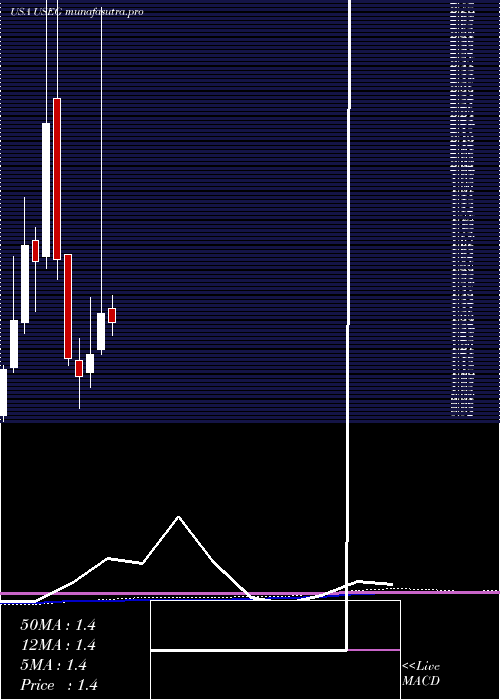
Monthly price and charts US Strong monthly Stock price targets for US USEG are 1.15 and 1.31 | Monthly Target 1 | 1.02 | | Monthly Target 2 | 1.11 | | Monthly Target 3 | 1.1833333333333 | | Monthly Target 4 | 1.27 | | Monthly Target 5 | 1.34 |
Monthly price and volumes U S
| Date |
Closing |
Open |
Range |
Volume |
Tue 21 October 2025 |
1.19 (0.85%) |
1.18 |
1.10 - 1.26 |
0.1131 times |
Tue 30 September 2025 |
1.18 (-0.84%) |
1.19 |
1.10 - 1.32 |
0.1519 times |
Fri 29 August 2025 |
1.19 (-0.83%) |
1.20 |
1.13 - 1.25 |
0.1006 times |
Thu 31 July 2025 |
1.20 (-14.29%) |
1.42 |
1.19 - 1.48 |
0.2779 times |
Mon 30 June 2025 |
1.40 (14.75%) |
1.24 |
1.22 - 2.75 |
3.71 times |
Fri 30 May 2025 |
1.22 (8.93%) |
1.14 |
1.07 - 1.47 |
0.1244 times |
Wed 30 April 2025 |
1.12 (-6.67%) |
1.19 |
0.98 - 1.29 |
0.098 times |
Mon 31 March 2025 |
1.20 (-26.83%) |
1.66 |
1.17 - 1.66 |
0.1331 times |
Fri 28 February 2025 |
1.64 (-26.79%) |
2.35 |
1.55 - 3.56 |
1.6182 times |
Fri 31 January 2025 |
2.24 (37.42%) |
1.65 |
1.60 - 6.40 |
3.6727 times |
Tue 31 December 2024 |
1.63 (-4.12%) |
1.72 |
1.41 - 1.78 |
0.0212 times |
DMA SMA EMA moving averages of U S USEG
DMA (daily moving average) of U S USEG
| DMA period | DMA value | | 5 day DMA | 1.2 | | 12 day DMA | 1.19 | | 20 day DMA | 1.2 | | 35 day DMA | 1.18 | | 50 day DMA | 1.18 | | 100 day DMA | 1.28 | | 150 day DMA | 1.25 | | 200 day DMA | 1.44 | EMA (exponential moving average) of U S USEG
| EMA period | EMA current | EMA prev | EMA prev2 | | 5 day EMA | 1.19 | 1.19 | 1.18 | | 12 day EMA | 1.18 | 1.18 | 1.18 | | 20 day EMA | 1.17 | 1.17 | 1.17 | | 35 day EMA | 1.17 | 1.17 | 1.17 | | 50 day EMA | 1.18 | 1.18 | 1.18 |
SMA (simple moving average) of U S USEG
| SMA period | SMA current | SMA prev | SMA prev2 | | 5 day SMA | 1.2 | 1.19 | 1.18 | | 12 day SMA | 1.19 | 1.19 | 1.19 | | 20 day SMA | 1.2 | 1.2 | 1.2 | | 35 day SMA | 1.18 | 1.18 | 1.18 | | 50 day SMA | 1.18 | 1.18 | 1.18 | | 100 day SMA | 1.28 | 1.28 | 1.28 | | 150 day SMA | 1.25 | 1.25 | 1.25 | | 200 day SMA | 1.44 | 1.44 | 1.45 |
|
|
