US USB full analysis,charts,indicators,moving averages,SMA,DMA,EMA,ADX,MACD,RSIU S USB WideScreen charts, DMA,SMA,EMA technical analysis, forecast prediction, by indicators ADX,MACD,RSI,CCI USA stock exchange
operates under Finance sector & deals in Major Banks
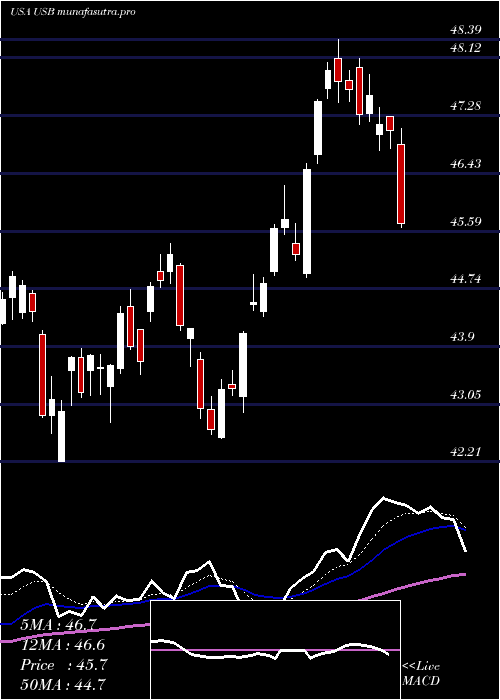
Daily price and charts and targets US Strong Daily Stock price targets for US USB are 46.51 and 47.79 | Daily Target 1 | 45.45 | | Daily Target 2 | 46.28 | | Daily Target 3 | 46.733333333333 | | Daily Target 4 | 47.56 | | Daily Target 5 | 48.01 |
Daily price and volume U S
| Date |
Closing |
Open |
Range |
Volume |
Mon 20 October 2025 |
47.10 (3.09%) |
45.97 |
45.91 - 47.19 |
0.9811 times |
Fri 17 October 2025 |
45.69 (-0.46%) |
45.01 |
44.36 - 46.62 |
1.2052 times |
Thu 16 October 2025 |
45.90 (-1.18%) |
46.34 |
45.39 - 48.24 |
1.7355 times |
Wed 15 October 2025 |
46.45 (-1.36%) |
47.36 |
46.17 - 47.42 |
1.1771 times |
Tue 14 October 2025 |
47.09 (2.01%) |
45.99 |
45.93 - 47.36 |
0.9193 times |
Mon 13 October 2025 |
46.16 (1.94%) |
45.89 |
45.59 - 46.32 |
0.7168 times |
Fri 10 October 2025 |
45.28 (-3.86%) |
47.34 |
45.23 - 47.40 |
1.2959 times |
Thu 09 October 2025 |
47.10 (0.23%) |
47.18 |
46.76 - 47.40 |
0.7287 times |
Wed 08 October 2025 |
46.99 (-1.07%) |
47.73 |
46.88 - 47.75 |
0.5525 times |
Tue 07 October 2025 |
47.50 (-0.46%) |
48.04 |
47.45 - 48.23 |
0.6879 times |
Mon 06 October 2025 |
47.72 (-0.81%) |
48.31 |
47.48 - 49.00 |
0.718 times |
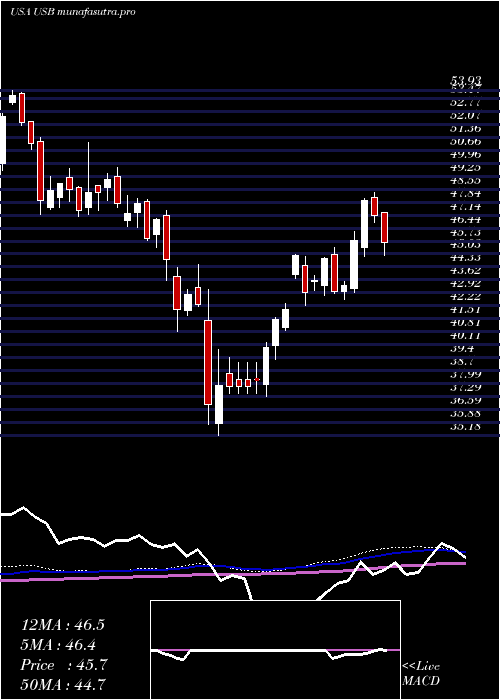
Weekly price and charts US Strong weekly Stock price targets for US USB are 46.51 and 47.79 | Weekly Target 1 | 45.45 | | Weekly Target 2 | 46.28 | | Weekly Target 3 | 46.733333333333 | | Weekly Target 4 | 47.56 | | Weekly Target 5 | 48.01 |
Weekly price and volumes for U S
| Date |
Closing |
Open |
Range |
Volume |
Mon 20 October 2025 |
47.10 (3.09%) |
45.97 |
45.91 - 47.19 |
0.238 times |
Fri 17 October 2025 |
45.69 (0.91%) |
45.89 |
44.36 - 48.24 |
1.3958 times |
Fri 10 October 2025 |
45.28 (-5.88%) |
48.31 |
45.23 - 49.00 |
0.9662 times |
Fri 03 October 2025 |
48.11 (-2.69%) |
49.42 |
47.47 - 49.51 |
1.1257 times |
Fri 26 September 2025 |
49.44 (-1.92%) |
49.94 |
48.81 - 50.22 |
1.0027 times |
Fri 19 September 2025 |
50.41 (2.61%) |
49.16 |
48.03 - 50.52 |
1.6806 times |
Fri 12 September 2025 |
49.13 (0.68%) |
48.84 |
48.03 - 49.99 |
1.3245 times |
Fri 05 September 2025 |
48.80 (-0.06%) |
48.34 |
47.95 - 49.49 |
0.731 times |
Fri 29 August 2025 |
48.83 (0%) |
48.72 |
48.58 - 49.06 |
0.3043 times |
Fri 29 August 2025 |
48.83 (1.14%) |
48.10 |
47.94 - 49.06 |
1.2311 times |
Fri 22 August 2025 |
48.28 (5.12%) |
45.81 |
45.72 - 48.36 |
0.9295 times |
Monthly price and charts US Strong monthly Stock price targets for US USB are 43.41 and 48.05 | Monthly Target 1 | 42.18 | | Monthly Target 2 | 44.64 | | Monthly Target 3 | 46.82 | | Monthly Target 4 | 49.28 | | Monthly Target 5 | 51.46 |
Monthly price and volumes U S
| Date |
Closing |
Open |
Range |
Volume |
Mon 20 October 2025 |
47.10 (-2.55%) |
48.18 |
44.36 - 49.00 |
0.6219 times |
Tue 30 September 2025 |
48.33 (-1.02%) |
48.34 |
47.47 - 50.52 |
1.0066 times |
Fri 29 August 2025 |
48.83 (8.61%) |
44.32 |
43.46 - 49.06 |
0.846 times |
Thu 31 July 2025 |
44.96 (-0.64%) |
44.97 |
44.02 - 48.39 |
1.3369 times |
Mon 30 June 2025 |
45.25 (3.81%) |
43.31 |
42.55 - 46.25 |
0.9759 times |
Fri 30 May 2025 |
43.59 (8.06%) |
40.16 |
39.99 - 45.00 |
0.7357 times |
Wed 30 April 2025 |
40.34 (-4.45%) |
41.86 |
35.18 - 43.07 |
1.3269 times |
Mon 31 March 2025 |
42.22 (-9.98%) |
47.11 |
40.81 - 47.37 |
1.3154 times |
Fri 28 February 2025 |
46.90 (-1.84%) |
46.84 |
45.37 - 48.20 |
0.7873 times |
Fri 31 January 2025 |
47.78 (-0.1%) |
48.18 |
47.05 - 51.12 |
1.0475 times |
Tue 31 December 2024 |
47.83 (-10.86%) |
52.23 |
47.18 - 52.26 |
0.5364 times |
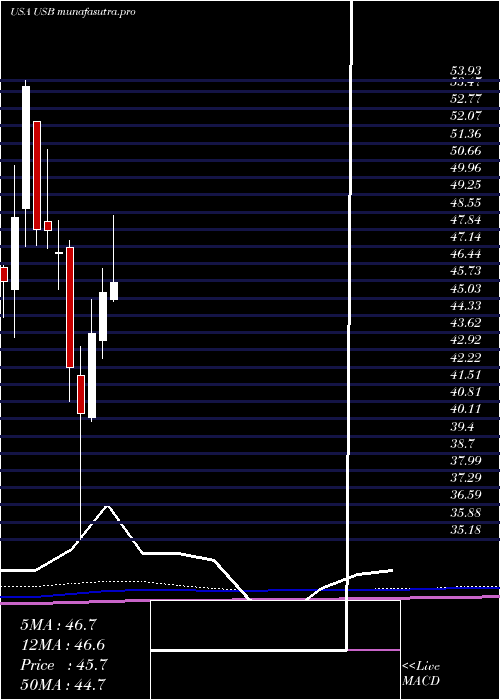
DMA SMA EMA moving averages of U S USB
DMA (daily moving average) of U S USB
| DMA period | DMA value | | 5 day DMA | 46.45 | | 12 day DMA | 46.76 | | 20 day DMA | 47.56 | | 35 day DMA | 48.27 | | 50 day DMA | 47.99 | | 100 day DMA | 46.6 | | 150 day DMA | 44.74 | | 200 day DMA | 45.28 | EMA (exponential moving average) of U S USB
| EMA period | EMA current | EMA prev | EMA prev2 | | 5 day EMA | 46.47 | 46.16 | 46.39 | | 12 day EMA | 46.83 | 46.78 | 46.98 | | 20 day EMA | 47.23 | 47.24 | 47.4 | | 35 day EMA | 47.38 | 47.4 | 47.5 | | 50 day EMA | 47.54 | 47.56 | 47.64 |
SMA (simple moving average) of U S USB
| SMA period | SMA current | SMA prev | SMA prev2 | | 5 day SMA | 46.45 | 46.26 | 46.18 | | 12 day SMA | 46.76 | 46.83 | 47.01 | | 20 day SMA | 47.56 | 47.68 | 47.92 | | 35 day SMA | 48.27 | 48.32 | 48.4 | | 50 day SMA | 47.99 | 47.94 | 47.92 | | 100 day SMA | 46.6 | 46.57 | 46.54 | | 150 day SMA | 44.74 | 44.7 | 44.67 | | 200 day SMA | 45.28 | 45.29 | 45.3 |
|
|
