US USAU full analysis,charts,indicators,moving averages,SMA,DMA,EMA,ADX,MACD,RSIU S USAU WideScreen charts, DMA,SMA,EMA technical analysis, forecast prediction, by indicators ADX,MACD,RSI,CCI USA stock exchange
operates under N A sector & deals in N A
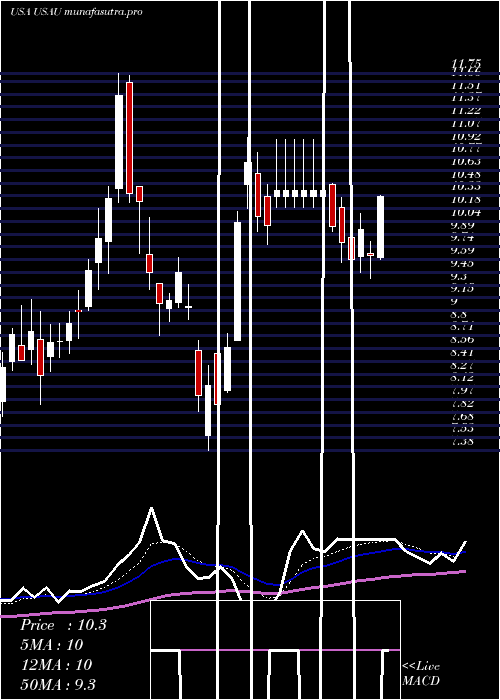
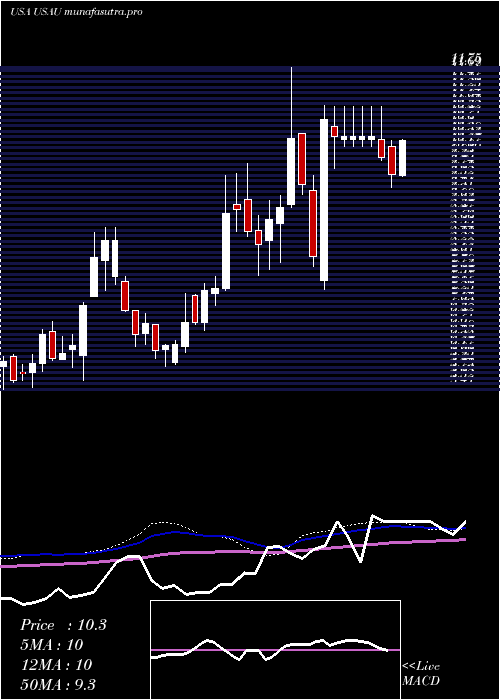
Daily price and charts and targets US Strong Daily Stock price targets for US USAU are 16.9 and 17.33 | Daily Target 1 | 16.79 | | Daily Target 2 | 17 | | Daily Target 3 | 17.223333333333 | | Daily Target 4 | 17.43 | | Daily Target 5 | 17.65 |
Daily price and volume U S
| Date |
Closing |
Open |
Range |
Volume |
Thu 04 December 2025 |
17.20 (-0.86%) |
17.27 |
17.02 - 17.45 |
0.8056 times |
Wed 03 December 2025 |
17.35 (3.46%) |
16.85 |
16.63 - 17.35 |
1.2396 times |
Tue 02 December 2025 |
16.77 (-0.53%) |
16.85 |
16.47 - 17.02 |
0.5035 times |
Mon 01 December 2025 |
16.86 (-2.32%) |
17.33 |
16.84 - 17.43 |
0.8518 times |
Fri 28 November 2025 |
17.26 (5.18%) |
16.48 |
16.26 - 17.44 |
1.2212 times |
Wed 26 November 2025 |
16.41 (3.66%) |
16.00 |
15.94 - 16.44 |
1.0115 times |
Tue 25 November 2025 |
15.83 (0.7%) |
15.70 |
15.38 - 15.97 |
0.9083 times |
Mon 24 November 2025 |
15.72 (6.36%) |
14.67 |
14.65 - 15.78 |
0.9126 times |
Fri 21 November 2025 |
14.78 (1.58%) |
14.50 |
14.22 - 14.92 |
1.1413 times |
Thu 20 November 2025 |
14.55 (-6.01%) |
15.34 |
14.53 - 15.66 |
1.4048 times |
Wed 19 November 2025 |
15.48 (-0.19%) |
15.77 |
15.22 - 15.94 |
0.9794 times |
Weekly price and charts US Strong weekly Stock price targets for US USAU are 16.35 and 17.33 | Weekly Target 1 | 16.06 | | Weekly Target 2 | 16.63 | | Weekly Target 3 | 17.04 | | Weekly Target 4 | 17.61 | | Weekly Target 5 | 18.02 |
Weekly price and volumes for U S
| Date |
Closing |
Open |
Range |
Volume |
Thu 04 December 2025 |
17.20 (-0.35%) |
17.33 |
16.47 - 17.45 |
0.5133 times |
Fri 28 November 2025 |
17.26 (16.78%) |
14.67 |
14.65 - 17.44 |
0.6119 times |
Fri 21 November 2025 |
14.78 (-0.74%) |
14.75 |
14.22 - 15.94 |
0.825 times |
Fri 14 November 2025 |
14.89 (-2.55%) |
15.67 |
14.52 - 16.03 |
0.8598 times |
Fri 07 November 2025 |
15.28 (-0.26%) |
14.98 |
14.37 - 15.31 |
0.6004 times |
Fri 31 October 2025 |
15.32 (0%) |
15.42 |
14.85 - 15.62 |
0.2092 times |
Fri 31 October 2025 |
15.32 (-8.32%) |
16.33 |
14.85 - 16.51 |
1.2392 times |
Fri 24 October 2025 |
16.71 (-5.22%) |
17.70 |
16.55 - 19.07 |
1.519 times |
Fri 17 October 2025 |
17.63 (0.17%) |
18.36 |
16.67 - 19.05 |
1.7673 times |
Fri 10 October 2025 |
17.60 (-1.73%) |
18.27 |
17.15 - 19.20 |
1.8549 times |
Fri 03 October 2025 |
17.91 (10.35%) |
16.50 |
15.50 - 18.20 |
1.4744 times |
Monthly price and charts US Strong monthly Stock price targets for US USAU are 16.35 and 17.33 | Monthly Target 1 | 16.06 | | Monthly Target 2 | 16.63 | | Monthly Target 3 | 17.04 | | Monthly Target 4 | 17.61 | | Monthly Target 5 | 18.02 |
Monthly price and volumes U S
| Date |
Closing |
Open |
Range |
Volume |
Thu 04 December 2025 |
17.20 (-0.35%) |
17.33 |
16.47 - 17.45 |
0.0996 times |
Fri 28 November 2025 |
17.26 (12.66%) |
14.98 |
14.22 - 17.44 |
0.5621 times |
Fri 31 October 2025 |
15.32 (-7.04%) |
16.70 |
14.85 - 19.20 |
1.4728 times |
Tue 30 September 2025 |
16.48 (25.51%) |
13.17 |
12.25 - 16.71 |
1.204 times |
Fri 29 August 2025 |
13.13 (28.47%) |
10.26 |
10.09 - 13.60 |
0.8956 times |
Thu 31 July 2025 |
10.22 (-16.23%) |
12.34 |
10.13 - 13.20 |
0.9661 times |
Mon 30 June 2025 |
12.20 (5.45%) |
12.05 |
11.62 - 14.39 |
1.5496 times |
Fri 30 May 2025 |
11.57 (5.47%) |
10.77 |
9.56 - 12.00 |
1.165 times |
Wed 30 April 2025 |
10.97 (20.68%) |
9.03 |
7.38 - 11.16 |
1.1144 times |
Mon 31 March 2025 |
9.09 (10.05%) |
8.35 |
7.77 - 11.75 |
0.9709 times |
Fri 28 February 2025 |
8.26 (11.77%) |
7.39 |
7.35 - 9.85 |
0.8688 times |

DMA SMA EMA moving averages of U S USAU
DMA (daily moving average) of U S USAU
| DMA period | DMA value | | 5 day DMA | 17.09 | | 12 day DMA | 16.14 | | 20 day DMA | 15.76 | | 35 day DMA | 16.04 | | 50 day DMA | 16.46 | | 100 day DMA | 14.54 | | 150 day DMA | 13.64 | | 200 day DMA | 12.57 | EMA (exponential moving average) of U S USAU
| EMA period | EMA current | EMA prev | EMA prev2 | | 5 day EMA | 16.95 | 16.82 | 16.56 | | 12 day EMA | 16.42 | 16.28 | 16.08 | | 20 day EMA | 16.18 | 16.07 | 15.94 | | 35 day EMA | 16.24 | 16.18 | 16.11 | | 50 day EMA | 16.47 | 16.44 | 16.4 |
SMA (simple moving average) of U S USAU
| SMA period | SMA current | SMA prev | SMA prev2 | | 5 day SMA | 17.09 | 16.93 | 16.63 | | 12 day SMA | 16.14 | 15.94 | 15.74 | | 20 day SMA | 15.76 | 15.64 | 15.51 | | 35 day SMA | 16.04 | 16.08 | 16.12 | | 50 day SMA | 16.46 | 16.42 | 16.39 | | 100 day SMA | 14.54 | 14.48 | 14.43 | | 150 day SMA | 13.64 | 13.59 | 13.55 | | 200 day SMA | 12.57 | 12.53 | 12.49 |
|
|
