UrbanOutfitters URBN full analysis,charts,indicators,moving averages,SMA,DMA,EMA,ADX,MACD,RSIUrban Outfitters URBN WideScreen charts, DMA,SMA,EMA technical analysis, forecast prediction, by indicators ADX,MACD,RSI,CCI USA stock exchange
operates under Consumer Services sector & deals in Clothing Shoe Accessory Stores
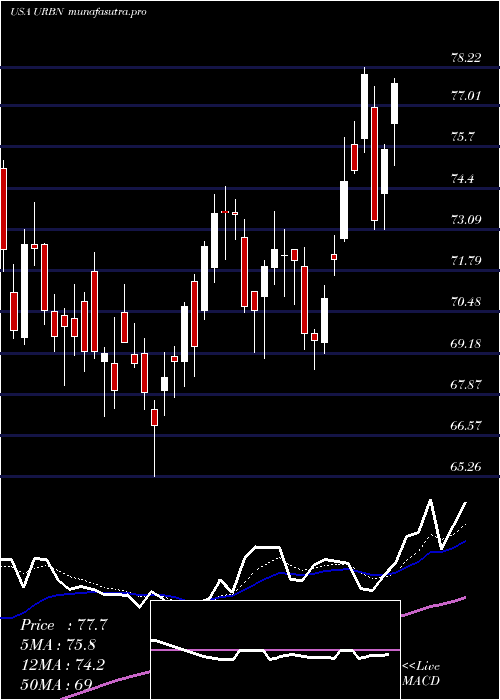
Daily price and charts and targets UrbanOutfitters Strong Daily Stock price targets for UrbanOutfitters URBN are 73.66 and 77.59 | Daily Target 1 | 72.98 | | Daily Target 2 | 74.33 | | Daily Target 3 | 76.906666666667 | | Daily Target 4 | 78.26 | | Daily Target 5 | 80.84 |
Daily price and volume Urban Outfitters
| Date |
Closing |
Open |
Range |
Volume |
Thu 04 December 2025 |
75.69 (-4.42%) |
79.44 |
75.55 - 79.48 |
0.3325 times |
Wed 03 December 2025 |
79.19 (1.06%) |
78.36 |
77.52 - 79.92 |
0.7373 times |
Tue 02 December 2025 |
78.36 (0.06%) |
78.06 |
76.43 - 78.80 |
1.0466 times |
Mon 01 December 2025 |
78.31 (5.72%) |
73.72 |
73.01 - 78.82 |
1.0211 times |
Fri 28 November 2025 |
74.07 (-4.46%) |
77.56 |
73.68 - 77.79 |
0.7934 times |
Wed 26 November 2025 |
77.53 (13.41%) |
80.08 |
74.00 - 81.40 |
2.1178 times |
Tue 25 November 2025 |
68.36 (9.87%) |
63.00 |
63.00 - 68.46 |
1.1323 times |
Mon 24 November 2025 |
62.22 (-2.95%) |
63.35 |
61.60 - 64.15 |
0.9197 times |
Fri 21 November 2025 |
64.11 (4.82%) |
62.00 |
61.47 - 64.74 |
1.0695 times |
Thu 20 November 2025 |
61.16 (2.67%) |
60.27 |
59.98 - 61.52 |
0.8299 times |
Wed 19 November 2025 |
59.57 (-2.96%) |
61.60 |
59.54 - 61.74 |
0.686 times |
Weekly price and charts UrbanOutfitters Strong weekly Stock price targets for UrbanOutfitters URBN are 74.35 and 81.26 | Weekly Target 1 | 69.3 | | Weekly Target 2 | 72.49 | | Weekly Target 3 | 76.206666666667 | | Weekly Target 4 | 79.4 | | Weekly Target 5 | 83.12 |
Weekly price and volumes for Urban Outfitters
| Date |
Closing |
Open |
Range |
Volume |
Thu 04 December 2025 |
75.69 (2.19%) |
73.72 |
73.01 - 79.92 |
1.078 times |
Fri 28 November 2025 |
74.07 (15.54%) |
63.35 |
61.60 - 81.40 |
1.7052 times |
Fri 21 November 2025 |
64.11 (4.31%) |
61.38 |
59.54 - 64.74 |
1.3369 times |
Fri 14 November 2025 |
61.46 (-3.82%) |
64.29 |
60.52 - 65.55 |
1.2038 times |
Fri 07 November 2025 |
63.90 (-1.1%) |
62.22 |
60.61 - 66.03 |
0.7799 times |
Fri 31 October 2025 |
64.61 (0%) |
65.95 |
63.73 - 65.95 |
0.2687 times |
Fri 31 October 2025 |
64.61 (-4.66%) |
68.86 |
63.73 - 69.34 |
0.9059 times |
Fri 24 October 2025 |
67.77 (1.32%) |
67.34 |
65.63 - 69.60 |
0.8791 times |
Fri 17 October 2025 |
66.89 (-2.12%) |
69.54 |
65.69 - 70.67 |
1.004 times |
Fri 10 October 2025 |
68.34 (-6.19%) |
73.06 |
67.95 - 73.80 |
0.8384 times |
Fri 03 October 2025 |
72.85 (-0.21%) |
73.50 |
69.98 - 73.69 |
0.6885 times |

Monthly price and charts UrbanOutfitters Strong monthly Stock price targets for UrbanOutfitters URBN are 74.35 and 81.26 | Monthly Target 1 | 69.3 | | Monthly Target 2 | 72.49 | | Monthly Target 3 | 76.206666666667 | | Monthly Target 4 | 79.4 | | Monthly Target 5 | 83.12 |
Monthly price and volumes Urban Outfitters
| Date |
Closing |
Open |
Range |
Volume |
Thu 04 December 2025 |
75.69 (2.19%) |
73.72 |
73.01 - 79.92 |
0.2414 times |
Fri 28 November 2025 |
74.07 (14.64%) |
62.22 |
59.54 - 81.40 |
1.1253 times |
Fri 31 October 2025 |
64.61 (-9.55%) |
70.96 |
63.73 - 73.80 |
0.9679 times |
Tue 30 September 2025 |
71.43 (6.48%) |
66.15 |
65.50 - 73.50 |
0.9388 times |
Fri 29 August 2025 |
67.08 (-10.89%) |
73.00 |
66.90 - 80.71 |
1.1315 times |
Thu 31 July 2025 |
75.28 (3.78%) |
71.89 |
68.67 - 78.22 |
0.9102 times |
Mon 30 June 2025 |
72.54 (3.78%) |
69.68 |
65.26 - 73.94 |
0.8613 times |
Fri 30 May 2025 |
69.90 (32.44%) |
52.70 |
51.12 - 75.80 |
1.4347 times |
Wed 30 April 2025 |
52.78 (0.73%) |
52.56 |
41.89 - 56.13 |
1.3553 times |
Mon 31 March 2025 |
52.40 (-9.95%) |
58.44 |
47.73 - 61.16 |
1.0337 times |
Fri 28 February 2025 |
58.19 (5%) |
53.57 |
51.94 - 58.90 |
0.8775 times |

DMA SMA EMA moving averages of Urban Outfitters URBN
DMA (daily moving average) of Urban Outfitters URBN
| DMA period | DMA value | | 5 day DMA | 77.12 | | 12 day DMA | 70 | | 20 day DMA | 66.92 | | 35 day DMA | 66.68 | | 50 day DMA | 67.98 | | 100 day DMA | 70.86 | | 150 day DMA | 69.47 | | 200 day DMA | 64.91 | EMA (exponential moving average) of Urban Outfitters URBN
| EMA period | EMA current | EMA prev | EMA prev2 | | 5 day EMA | 76.09 | 76.29 | 74.84 | | 12 day EMA | 72.14 | 71.5 | 70.1 | | 20 day EMA | 69.89 | 69.28 | 68.24 | | 35 day EMA | 68.95 | 68.55 | 67.92 | | 50 day EMA | 69.2 | 68.94 | 68.52 |
SMA (simple moving average) of Urban Outfitters URBN
| SMA period | SMA current | SMA prev | SMA prev2 | | 5 day SMA | 77.12 | 77.49 | 75.33 | | 12 day SMA | 70 | 68.78 | 67.3 | | 20 day SMA | 66.92 | 66.36 | 65.56 | | 35 day SMA | 66.68 | 66.46 | 66.14 | | 50 day SMA | 67.98 | 67.89 | 67.75 | | 100 day SMA | 70.86 | 70.8 | 70.73 | | 150 day SMA | 69.47 | 69.31 | 69.14 | | 200 day SMA | 64.91 | 64.81 | 64.7 |
|
|
