UnityBancorp UNTY full analysis,charts,indicators,moving averages,SMA,DMA,EMA,ADX,MACD,RSIUnity Bancorp UNTY WideScreen charts, DMA,SMA,EMA technical analysis, forecast prediction, by indicators ADX,MACD,RSI,CCI USA stock exchange
operates under Finance sector & deals in Major Banks
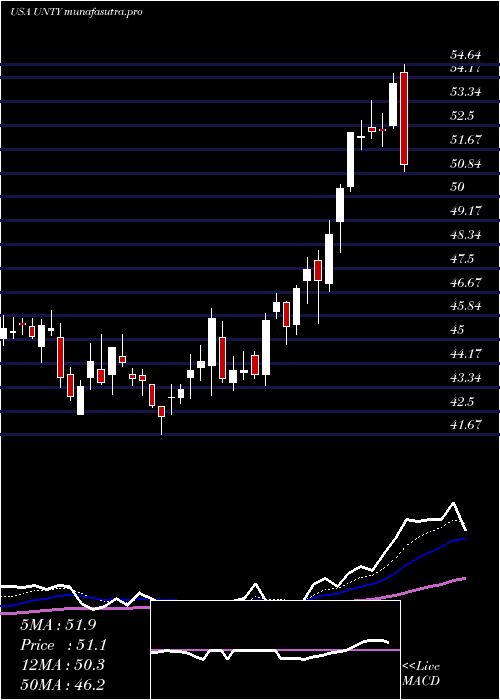
Daily price and charts and targets UnityBancorp Strong Daily Stock price targets for UnityBancorp UNTY are 51.64 and 53 | Daily Target 1 | 50.56 | | Daily Target 2 | 51.36 | | Daily Target 3 | 51.923333333333 | | Daily Target 4 | 52.72 | | Daily Target 5 | 53.28 |
Daily price and volume Unity Bancorp
| Date |
Closing |
Open |
Range |
Volume |
Thu 04 December 2025 |
52.15 (-0.1%) |
51.80 |
51.13 - 52.49 |
0.7937 times |
Wed 03 December 2025 |
52.20 (3.51%) |
50.39 |
50.39 - 52.50 |
1.4732 times |
Tue 02 December 2025 |
50.43 (-0.45%) |
50.50 |
50.04 - 50.99 |
1.0854 times |
Mon 01 December 2025 |
50.66 (1.26%) |
49.71 |
49.71 - 50.95 |
0.6855 times |
Fri 28 November 2025 |
50.03 (-0.56%) |
50.48 |
49.86 - 50.90 |
0.3307 times |
Wed 26 November 2025 |
50.31 (-0.26%) |
50.03 |
49.69 - 50.58 |
0.8419 times |
Tue 25 November 2025 |
50.44 (3.09%) |
49.27 |
49.27 - 50.80 |
0.9922 times |
Mon 24 November 2025 |
48.93 (0.31%) |
48.82 |
48.56 - 49.52 |
1.7108 times |
Fri 21 November 2025 |
48.78 (2.35%) |
47.60 |
47.60 - 49.29 |
0.89 times |
Thu 20 November 2025 |
47.66 (-0.87%) |
48.72 |
47.42 - 49.40 |
1.1966 times |
Wed 19 November 2025 |
48.08 (1.82%) |
46.98 |
46.64 - 48.51 |
1.5785 times |
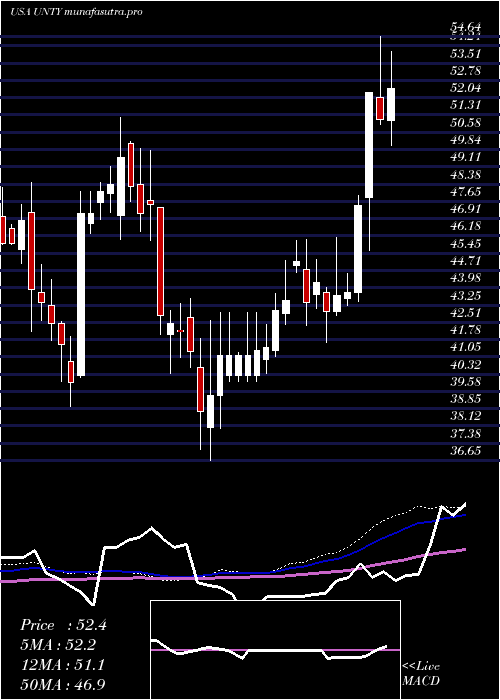
Weekly price and charts UnityBancorp Strong weekly Stock price targets for UnityBancorp UNTY are 50.93 and 53.72 | Weekly Target 1 | 48.66 | | Weekly Target 2 | 50.41 | | Weekly Target 3 | 51.453333333333 | | Weekly Target 4 | 53.2 | | Weekly Target 5 | 54.24 |
Weekly price and volumes for Unity Bancorp
| Date |
Closing |
Open |
Range |
Volume |
Thu 04 December 2025 |
52.15 (4.24%) |
49.71 |
49.71 - 52.50 |
0.7359 times |
Fri 28 November 2025 |
50.03 (2.56%) |
48.82 |
48.56 - 50.90 |
0.7063 times |
Fri 21 November 2025 |
48.78 (0.43%) |
48.34 |
46.47 - 49.40 |
1.1238 times |
Fri 14 November 2025 |
48.57 (4.16%) |
47.27 |
46.54 - 48.60 |
0.954 times |
Fri 07 November 2025 |
46.63 (2.69%) |
45.12 |
44.50 - 46.63 |
1.0641 times |
Fri 31 October 2025 |
45.41 (0%) |
45.16 |
44.34 - 45.75 |
0.1693 times |
Fri 31 October 2025 |
45.41 (-5.47%) |
48.27 |
44.34 - 48.33 |
0.9216 times |
Fri 24 October 2025 |
48.04 (0.78%) |
48.27 |
47.32 - 49.48 |
0.8263 times |
Fri 17 October 2025 |
47.67 (2.25%) |
47.00 |
46.12 - 50.28 |
1.7753 times |
Fri 10 October 2025 |
46.62 (-3.62%) |
48.74 |
46.56 - 50.71 |
1.7233 times |
Fri 03 October 2025 |
48.37 (-3.24%) |
50.17 |
47.32 - 50.54 |
0.9851 times |
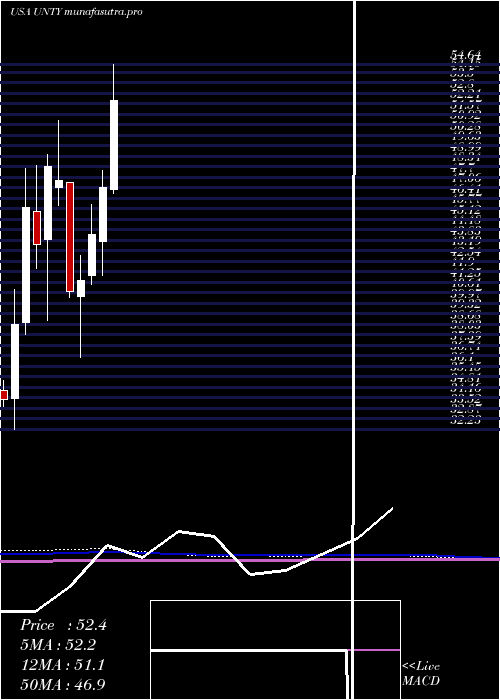
Monthly price and charts UnityBancorp Strong monthly Stock price targets for UnityBancorp UNTY are 50.93 and 53.72 | Monthly Target 1 | 48.66 | | Monthly Target 2 | 50.41 | | Monthly Target 3 | 51.453333333333 | | Monthly Target 4 | 53.2 | | Monthly Target 5 | 54.24 |
Monthly price and volumes Unity Bancorp
| Date |
Closing |
Open |
Range |
Volume |
Thu 04 December 2025 |
52.15 (4.24%) |
49.71 |
49.71 - 52.50 |
0.1531 times |
Fri 28 November 2025 |
50.03 (10.17%) |
45.12 |
44.50 - 50.90 |
0.8008 times |
Fri 31 October 2025 |
45.41 (-7.08%) |
48.55 |
44.34 - 50.71 |
1.2243 times |
Tue 30 September 2025 |
48.87 (-6.65%) |
51.88 |
47.65 - 53.95 |
0.7436 times |
Fri 29 August 2025 |
52.35 (6.6%) |
48.70 |
46.44 - 52.92 |
0.8934 times |
Thu 31 July 2025 |
49.11 (4.31%) |
46.96 |
46.69 - 54.64 |
1.919 times |
Mon 30 June 2025 |
47.08 (6.49%) |
43.79 |
41.67 - 48.11 |
1.6335 times |
Fri 30 May 2025 |
44.21 (6.79%) |
41.66 |
41.12 - 46.02 |
1.0938 times |
Wed 30 April 2025 |
41.40 (1.72%) |
40.38 |
36.65 - 42.93 |
0.7816 times |
Mon 31 March 2025 |
40.70 (-14.3%) |
47.36 |
40.32 - 47.36 |
0.7568 times |
Fri 28 February 2025 |
47.49 (-1.78%) |
47.05 |
45.99 - 51.22 |
0.863 times |
DMA SMA EMA moving averages of Unity Bancorp UNTY
DMA (daily moving average) of Unity Bancorp UNTY
| DMA period | DMA value | | 5 day DMA | 51.09 | | 12 day DMA | 49.74 | | 20 day DMA | 48.79 | | 35 day DMA | 48.05 | | 50 day DMA | 48.3 | | 100 day DMA | 49.58 | | 150 day DMA | 48.32 | | 200 day DMA | 46.84 | EMA (exponential moving average) of Unity Bancorp UNTY
| EMA period | EMA current | EMA prev | EMA prev2 | | 5 day EMA | 51.27 | 50.83 | 50.14 | | 12 day EMA | 50.11 | 49.74 | 49.29 | | 20 day EMA | 49.39 | 49.1 | 48.77 | | 35 day EMA | 49.06 | 48.88 | 48.68 | | 50 day EMA | 48.86 | 48.73 | 48.59 |
SMA (simple moving average) of Unity Bancorp UNTY
| SMA period | SMA current | SMA prev | SMA prev2 | | 5 day SMA | 51.09 | 50.73 | 50.37 | | 12 day SMA | 49.74 | 49.32 | 49.01 | | 20 day SMA | 48.79 | 48.47 | 48.13 | | 35 day SMA | 48.05 | 47.99 | 47.9 | | 50 day SMA | 48.3 | 48.26 | 48.24 | | 100 day SMA | 49.58 | 49.58 | 49.58 | | 150 day SMA | 48.32 | 48.25 | 48.18 | | 200 day SMA | 46.84 | 46.83 | 46.81 |
|
|
