UnionBankshares UNB full analysis,charts,indicators,moving averages,SMA,DMA,EMA,ADX,MACD,RSIUnion Bankshares UNB WideScreen charts, DMA,SMA,EMA technical analysis, forecast prediction, by indicators ADX,MACD,RSI,CCI USA stock exchange
operates under Finance sector & deals in Major Banks
Daily price and charts and targets UnionBankshares Strong Daily Stock price targets for UnionBankshares UNB are 24.63 and 25 | Daily Target 1 | 24.55 | | Daily Target 2 | 24.7 | | Daily Target 3 | 24.923333333333 | | Daily Target 4 | 25.07 | | Daily Target 5 | 25.29 |
Daily price and volume Union Bankshares
| Date |
Closing |
Open |
Range |
Volume |
Tue 21 October 2025 |
24.84 (-0.64%) |
24.96 |
24.78 - 25.15 |
1.4311 times |
Mon 20 October 2025 |
25.00 (2.71%) |
24.37 |
24.37 - 25.00 |
0.8371 times |
Fri 17 October 2025 |
24.34 (-1.02%) |
24.59 |
24.31 - 25.23 |
1.8632 times |
Thu 16 October 2025 |
24.59 (0.24%) |
24.93 |
24.59 - 25.41 |
0.6121 times |
Wed 15 October 2025 |
24.53 (-1.88%) |
25.30 |
24.53 - 25.30 |
0.216 times |
Tue 14 October 2025 |
25.00 (0.68%) |
24.25 |
24.25 - 25.28 |
0.7741 times |
Mon 13 October 2025 |
24.83 (4.07%) |
24.29 |
24.29 - 24.83 |
0.387 times |
Fri 10 October 2025 |
23.86 (-2.61%) |
25.90 |
23.80 - 25.90 |
2.6553 times |
Thu 09 October 2025 |
24.50 (-2.39%) |
25.97 |
24.50 - 25.97 |
0.7741 times |
Wed 08 October 2025 |
25.10 (-0.44%) |
24.91 |
24.91 - 25.87 |
0.45 times |
Tue 07 October 2025 |
25.21 (0.44%) |
25.12 |
25.10 - 25.44 |
0.297 times |
Weekly price and charts UnionBankshares Strong weekly Stock price targets for UnionBankshares UNB are 24.61 and 25.39 | Weekly Target 1 | 24.01 | | Weekly Target 2 | 24.42 | | Weekly Target 3 | 24.786666666667 | | Weekly Target 4 | 25.2 | | Weekly Target 5 | 25.57 |
Weekly price and volumes for Union Bankshares
| Date |
Closing |
Open |
Range |
Volume |
Tue 21 October 2025 |
24.84 (2.05%) |
24.37 |
24.37 - 25.15 |
0.6379 times |
Fri 17 October 2025 |
24.34 (2.01%) |
24.29 |
24.25 - 25.41 |
1.0835 times |
Fri 10 October 2025 |
23.86 (-4.52%) |
25.61 |
23.80 - 25.97 |
1.2658 times |
Fri 03 October 2025 |
24.99 (-0.99%) |
25.79 |
24.50 - 25.79 |
1.0132 times |
Fri 26 September 2025 |
25.24 (-3.92%) |
26.32 |
24.78 - 26.43 |
1.8581 times |
Fri 19 September 2025 |
26.27 (1.08%) |
26.02 |
25.83 - 26.54 |
2.2201 times |
Fri 12 September 2025 |
25.99 (0.5%) |
26.03 |
25.72 - 26.34 |
0.5924 times |
Fri 05 September 2025 |
25.86 (-1.18%) |
26.10 |
25.85 - 26.36 |
0.4228 times |
Fri 29 August 2025 |
26.17 (0%) |
26.36 |
26.10 - 26.36 |
0.1266 times |
Fri 29 August 2025 |
26.17 (-3.79%) |
26.78 |
25.68 - 27.11 |
0.7797 times |
Fri 22 August 2025 |
27.20 (-0.37%) |
27.28 |
25.90 - 27.28 |
0.9873 times |
Monthly price and charts UnionBankshares Strong monthly Stock price targets for UnionBankshares UNB are 24.32 and 26.49 | Monthly Target 1 | 22.7 | | Monthly Target 2 | 23.77 | | Monthly Target 3 | 24.87 | | Monthly Target 4 | 25.94 | | Monthly Target 5 | 27.04 |
Monthly price and volumes Union Bankshares
| Date |
Closing |
Open |
Range |
Volume |
Tue 21 October 2025 |
24.84 (0.32%) |
24.74 |
23.80 - 25.97 |
0.6413 times |
Tue 30 September 2025 |
24.76 (-5.39%) |
26.10 |
24.51 - 26.54 |
0.9773 times |
Fri 29 August 2025 |
26.17 (-3.82%) |
27.18 |
25.68 - 27.74 |
0.5839 times |
Thu 31 July 2025 |
27.21 (2.22%) |
26.99 |
26.41 - 29.49 |
0.8877 times |
Mon 30 June 2025 |
26.62 (-9.73%) |
29.81 |
24.97 - 29.82 |
2.7242 times |
Fri 30 May 2025 |
29.49 (-10.85%) |
33.13 |
27.73 - 36.00 |
1.0845 times |
Wed 30 April 2025 |
33.08 (5.12%) |
31.01 |
27.00 - 35.73 |
0.9939 times |
Mon 31 March 2025 |
31.47 (7.77%) |
28.31 |
27.29 - 32.90 |
0.868 times |
Fri 28 February 2025 |
29.20 (-8.46%) |
30.79 |
27.94 - 35.00 |
0.5821 times |
Fri 31 January 2025 |
31.90 (10.34%) |
28.42 |
27.92 - 32.54 |
0.657 times |
Tue 31 December 2024 |
28.91 (-14.11%) |
35.60 |
25.90 - 36.25 |
0.7015 times |

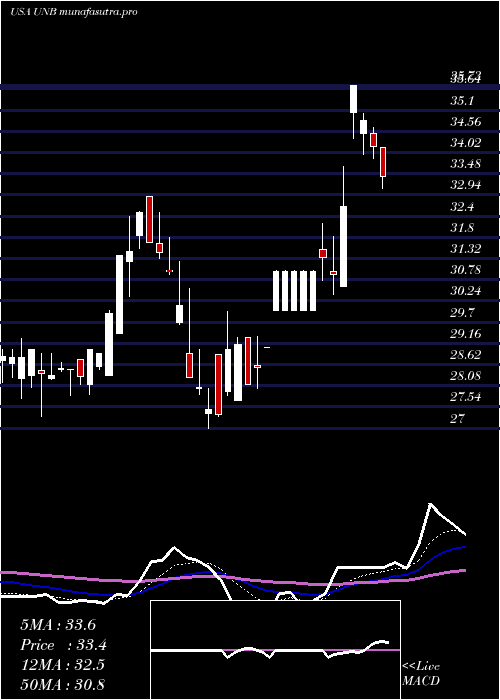
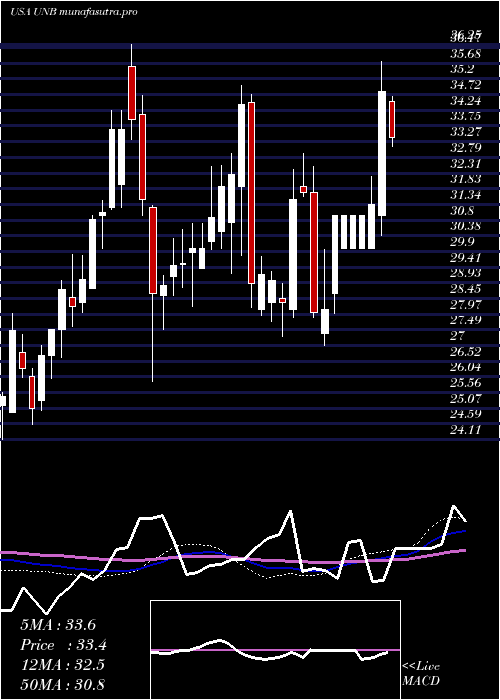
DMA SMA EMA moving averages of Union Bankshares UNB
DMA (daily moving average) of Union Bankshares UNB
| DMA period | DMA value | | 5 day DMA | 24.66 | | 12 day DMA | 24.74 | | 20 day DMA | 24.86 | | 35 day DMA | 25.34 | | 50 day DMA | 25.72 | | 100 day DMA | 26.63 | | 150 day DMA | 28.31 | | 200 day DMA | 28.83 | EMA (exponential moving average) of Union Bankshares UNB
| EMA period | EMA current | EMA prev | EMA prev2 | | 5 day EMA | 24.75 | 24.7 | 24.55 | | 12 day EMA | 24.79 | 24.78 | 24.74 | | 20 day EMA | 24.95 | 24.96 | 24.96 | | 35 day EMA | 25.28 | 25.31 | 25.33 | | 50 day EMA | 25.68 | 25.71 | 25.74 |
SMA (simple moving average) of Union Bankshares UNB
| SMA period | SMA current | SMA prev | SMA prev2 | | 5 day SMA | 24.66 | 24.69 | 24.66 | | 12 day SMA | 24.74 | 24.75 | 24.73 | | 20 day SMA | 24.86 | 24.91 | 24.96 | | 35 day SMA | 25.34 | 25.37 | 25.41 | | 50 day SMA | 25.72 | 25.77 | 25.79 | | 100 day SMA | 26.63 | 26.68 | 26.72 | | 150 day SMA | 28.31 | 28.34 | 28.36 | | 200 day SMA | 28.83 | 28.85 | 28.86 |
|
|
