UmbFinancial UMBF full analysis,charts,indicators,moving averages,SMA,DMA,EMA,ADX,MACD,RSIUmb Financial UMBF WideScreen charts, DMA,SMA,EMA technical analysis, forecast prediction, by indicators ADX,MACD,RSI,CCI USA stock exchange
operates under Finance sector & deals in Major Banks
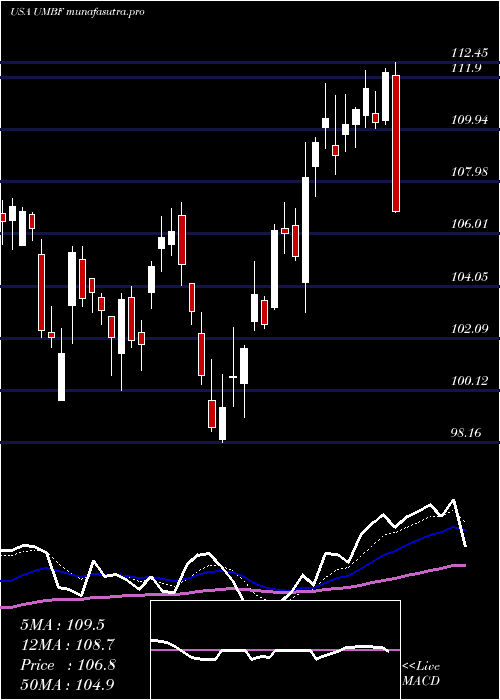
Daily price and charts and targets UmbFinancial Strong Daily Stock price targets for UmbFinancial UMBF are 114.97 and 116.98 | Daily Target 1 | 113.33 | | Daily Target 2 | 114.6 | | Daily Target 3 | 115.33666666667 | | Daily Target 4 | 116.61 | | Daily Target 5 | 117.35 |
Daily price and volume Umb Financial
| Date |
Closing |
Open |
Range |
Volume |
Thu 04 December 2025 |
115.88 (0.77%) |
114.38 |
114.06 - 116.07 |
1.2993 times |
Wed 03 December 2025 |
115.00 (3.6%) |
111.57 |
110.40 - 115.17 |
1.4034 times |
Tue 02 December 2025 |
111.00 (-1.29%) |
112.99 |
110.82 - 113.61 |
0.8025 times |
Mon 01 December 2025 |
112.45 (1.23%) |
110.35 |
110.02 - 112.84 |
0.8922 times |
Fri 28 November 2025 |
111.08 (-0.84%) |
112.23 |
110.61 - 112.38 |
0.3787 times |
Wed 26 November 2025 |
112.02 (-0.16%) |
111.71 |
111.40 - 113.04 |
0.8037 times |
Tue 25 November 2025 |
112.20 (2.74%) |
109.45 |
109.36 - 114.18 |
1.1225 times |
Mon 24 November 2025 |
109.21 (0.35%) |
108.30 |
107.50 - 109.72 |
1.1969 times |
Fri 21 November 2025 |
108.83 (4.27%) |
104.95 |
104.62 - 110.23 |
1.2367 times |
Thu 20 November 2025 |
104.37 (0.28%) |
105.44 |
103.81 - 106.62 |
0.8641 times |
Wed 19 November 2025 |
104.08 (-0.09%) |
104.33 |
103.52 - 105.95 |
0.8842 times |
Weekly price and charts UmbFinancial Strong weekly Stock price targets for UmbFinancial UMBF are 112.95 and 119 | Weekly Target 1 | 107.94 | | Weekly Target 2 | 111.91 | | Weekly Target 3 | 113.99 | | Weekly Target 4 | 117.96 | | Weekly Target 5 | 120.04 |
Weekly price and volumes for Umb Financial
| Date |
Closing |
Open |
Range |
Volume |
Thu 04 December 2025 |
115.88 (4.32%) |
110.35 |
110.02 - 116.07 |
0.9234 times |
Fri 28 November 2025 |
111.08 (2.07%) |
108.30 |
107.50 - 114.18 |
0.7353 times |
Fri 21 November 2025 |
108.83 (0.4%) |
107.88 |
103.38 - 110.23 |
1.025 times |
Fri 14 November 2025 |
108.40 (-0.54%) |
109.13 |
107.60 - 111.32 |
1.0391 times |
Fri 07 November 2025 |
108.99 (1.97%) |
106.75 |
104.92 - 109.10 |
1.0354 times |
Fri 31 October 2025 |
106.88 (0%) |
106.56 |
103.86 - 107.34 |
0.3365 times |
Fri 31 October 2025 |
106.88 (-5.89%) |
114.25 |
103.86 - 114.65 |
1.6728 times |
Fri 24 October 2025 |
113.57 (4.34%) |
109.66 |
108.79 - 114.17 |
0.9954 times |
Fri 17 October 2025 |
108.85 (-3.69%) |
114.71 |
106.41 - 119.35 |
1.2897 times |
Fri 10 October 2025 |
113.02 (-5.42%) |
119.84 |
112.85 - 121.89 |
0.9474 times |
Fri 03 October 2025 |
119.50 (0.06%) |
120.49 |
115.99 - 121.50 |
0.9315 times |
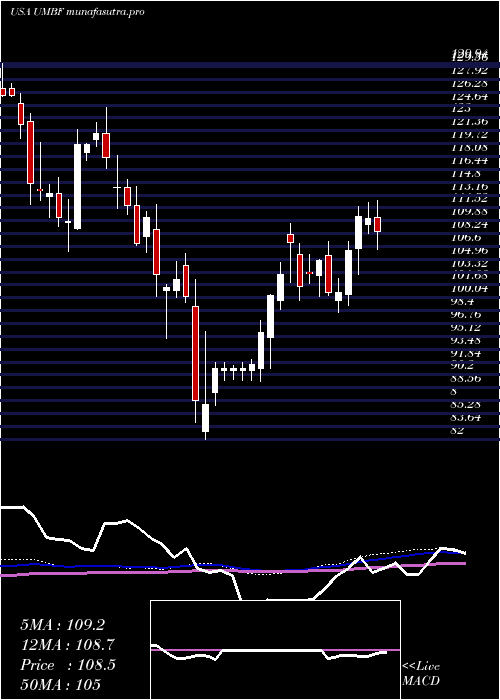
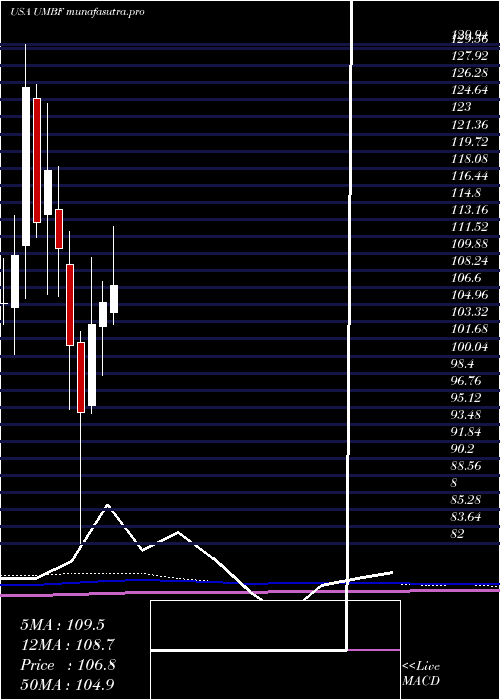
Monthly price and charts UmbFinancial Strong monthly Stock price targets for UmbFinancial UMBF are 112.95 and 119 | Monthly Target 1 | 107.94 | | Monthly Target 2 | 111.91 | | Monthly Target 3 | 113.99 | | Monthly Target 4 | 117.96 | | Monthly Target 5 | 120.04 |
Monthly price and volumes Umb Financial
| Date |
Closing |
Open |
Range |
Volume |
Thu 04 December 2025 |
115.88 (4.32%) |
110.35 |
110.02 - 116.07 |
0.1723 times |
Fri 28 November 2025 |
111.08 (3.93%) |
106.75 |
103.38 - 114.18 |
0.7155 times |
Fri 31 October 2025 |
106.88 (-9.69%) |
117.77 |
103.86 - 121.89 |
1.0672 times |
Tue 30 September 2025 |
118.35 (-2.91%) |
120.92 |
116.74 - 126.14 |
0.9848 times |
Fri 29 August 2025 |
121.90 (10.83%) |
108.41 |
105.51 - 124.20 |
1.1261 times |
Thu 31 July 2025 |
109.99 (4.59%) |
104.18 |
103.07 - 114.39 |
1.1646 times |
Mon 30 June 2025 |
105.16 (1.98%) |
102.90 |
98.16 - 107.20 |
1.2622 times |
Fri 30 May 2025 |
103.12 (9.04%) |
95.25 |
94.48 - 109.46 |
0.9741 times |
Wed 30 April 2025 |
94.57 (-6.46%) |
101.36 |
82.00 - 102.39 |
1.3943 times |
Mon 31 March 2025 |
101.10 (-8.37%) |
108.80 |
94.90 - 112.00 |
1.1389 times |
Fri 28 February 2025 |
110.33 (-6.42%) |
114.09 |
105.81 - 118.20 |
1.3229 times |
DMA SMA EMA moving averages of Umb Financial UMBF
DMA (daily moving average) of Umb Financial UMBF
| DMA period | DMA value | | 5 day DMA | 113.08 | | 12 day DMA | 110.02 | | 20 day DMA | 109.38 | | 35 day DMA | 109.5 | | 50 day DMA | 112.07 | | 100 day DMA | 114.18 | | 150 day DMA | 111.02 | | 200 day DMA | 107.88 | EMA (exponential moving average) of Umb Financial UMBF
| EMA period | EMA current | EMA prev | EMA prev2 | | 5 day EMA | 113.53 | 112.35 | 111.03 | | 12 day EMA | 111.43 | 110.62 | 109.82 | | 20 day EMA | 110.71 | 110.17 | 109.66 | | 35 day EMA | 111.6 | 111.35 | 111.13 | | 50 day EMA | 112.92 | 112.8 | 112.71 |
SMA (simple moving average) of Umb Financial UMBF
| SMA period | SMA current | SMA prev | SMA prev2 | | 5 day SMA | 113.08 | 112.31 | 111.75 | | 12 day SMA | 110.02 | 109.03 | 108.48 | | 20 day SMA | 109.38 | 108.94 | 108.51 | | 35 day SMA | 109.5 | 109.51 | 109.6 | | 50 day SMA | 112.07 | 112.13 | 112.22 | | 100 day SMA | 114.18 | 114.09 | 114.06 | | 150 day SMA | 111.02 | 110.88 | 110.76 | | 200 day SMA | 107.88 | 107.87 | 107.85 |
|
|
