UnileverPlc UL full analysis,charts,indicators,moving averages,SMA,DMA,EMA,ADX,MACD,RSIUnilever Plc UL WideScreen charts, DMA,SMA,EMA technical analysis, forecast prediction, by indicators ADX,MACD,RSI,CCI USA stock exchange
operates under Basic Industries sector & deals in Package Goods Cosmetics
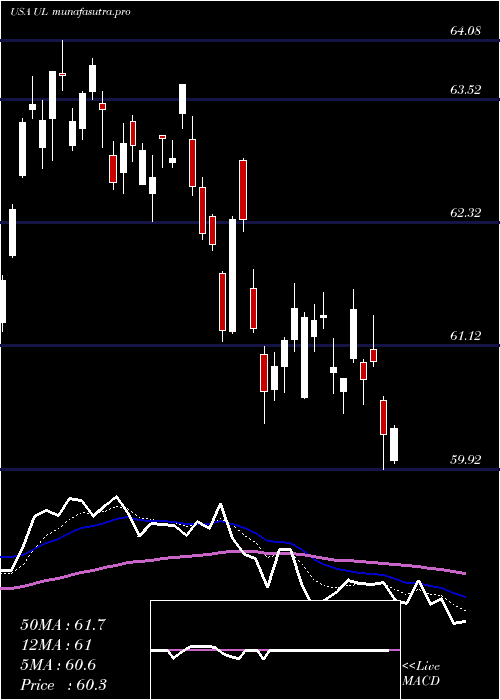
Daily price and charts and targets UnileverPlc Strong Daily Stock price targets for UnileverPlc UL are 62.77 and 63.25 | Daily Target 1 | 62.41 | | Daily Target 2 | 62.65 | | Daily Target 3 | 62.89 | | Daily Target 4 | 63.13 | | Daily Target 5 | 63.37 |
Daily price and volume Unilever Plc
| Date |
Closing |
Open |
Range |
Volume |
Mon 20 October 2025 |
62.89 (-0.36%) |
62.68 |
62.65 - 63.13 |
0.6432 times |
Fri 17 October 2025 |
63.12 (1.77%) |
62.35 |
62.31 - 63.30 |
0.9826 times |
Thu 16 October 2025 |
62.02 (1.87%) |
61.25 |
61.19 - 62.19 |
1.8012 times |
Wed 15 October 2025 |
60.88 (-0.18%) |
60.23 |
60.19 - 60.96 |
1.5492 times |
Tue 14 October 2025 |
60.99 (1.5%) |
60.27 |
60.27 - 61.12 |
0.9566 times |
Mon 13 October 2025 |
60.09 (-0.56%) |
59.71 |
59.61 - 60.23 |
0.9839 times |
Fri 10 October 2025 |
60.43 (2.55%) |
59.57 |
59.57 - 60.50 |
1.3831 times |
Thu 09 October 2025 |
58.93 (0.49%) |
59.02 |
58.67 - 59.13 |
0.6563 times |
Wed 08 October 2025 |
58.64 (0.05%) |
59.01 |
58.58 - 59.01 |
0.4744 times |
Tue 07 October 2025 |
58.61 (0.05%) |
58.34 |
58.24 - 58.93 |
0.5695 times |
Mon 06 October 2025 |
58.58 (-0.81%) |
58.83 |
58.44 - 58.87 |
0.4107 times |
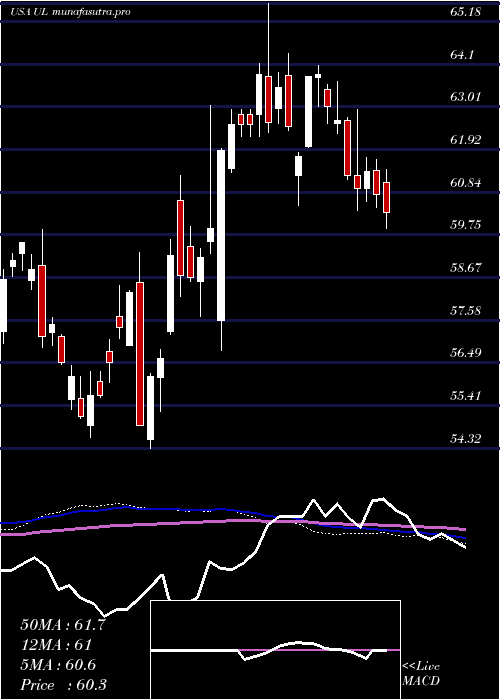
Weekly price and charts UnileverPlc Strong weekly Stock price targets for UnileverPlc UL are 62.77 and 63.25 | Weekly Target 1 | 62.41 | | Weekly Target 2 | 62.65 | | Weekly Target 3 | 62.89 | | Weekly Target 4 | 63.13 | | Weekly Target 5 | 63.37 |
Weekly price and volumes for Unilever Plc
| Date |
Closing |
Open |
Range |
Volume |
Mon 20 October 2025 |
62.89 (-0.36%) |
62.68 |
62.65 - 63.13 |
0.2265 times |
Fri 17 October 2025 |
63.12 (4.45%) |
59.71 |
59.61 - 63.30 |
2.2087 times |
Fri 10 October 2025 |
60.43 (2.32%) |
58.83 |
58.24 - 60.50 |
1.2301 times |
Fri 03 October 2025 |
59.06 (-0.37%) |
59.00 |
58.67 - 59.69 |
0.9426 times |
Fri 26 September 2025 |
59.28 (-3.14%) |
61.15 |
59.05 - 61.15 |
1.1926 times |
Fri 19 September 2025 |
61.20 (-2.69%) |
62.69 |
61.20 - 62.91 |
0.9717 times |
Fri 12 September 2025 |
62.89 (-2.21%) |
63.89 |
62.60 - 64.10 |
0.9158 times |
Fri 05 September 2025 |
64.31 (1.76%) |
63.50 |
63.25 - 65.01 |
1.0692 times |
Fri 29 August 2025 |
63.20 (0%) |
62.77 |
62.68 - 63.26 |
0.3043 times |
Fri 29 August 2025 |
63.20 (0.22%) |
63.02 |
61.79 - 63.26 |
0.9385 times |
Fri 22 August 2025 |
63.06 (3.38%) |
60.95 |
60.86 - 63.70 |
0.9952 times |
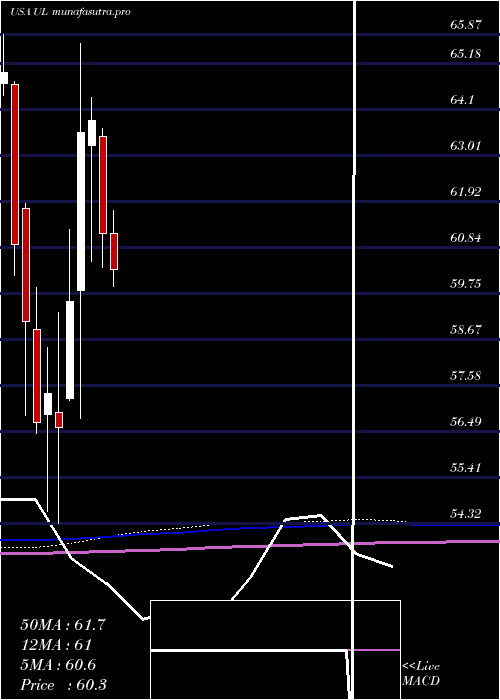
Monthly price and charts UnileverPlc Strong monthly Stock price targets for UnileverPlc UL are 60.57 and 65.63 | Monthly Target 1 | 56.42 | | Monthly Target 2 | 59.65 | | Monthly Target 3 | 61.476666666667 | | Monthly Target 4 | 64.71 | | Monthly Target 5 | 66.54 |
Monthly price and volumes Unilever Plc
| Date |
Closing |
Open |
Range |
Volume |
Mon 20 October 2025 |
62.89 (6.09%) |
59.62 |
58.24 - 63.30 |
0.9094 times |
Tue 30 September 2025 |
59.28 (-6.2%) |
63.50 |
58.71 - 65.01 |
0.9929 times |
Fri 29 August 2025 |
63.20 (8.16%) |
60.23 |
59.85 - 63.70 |
0.9438 times |
Thu 31 July 2025 |
58.43 (-4.48%) |
61.18 |
58.16 - 61.72 |
0.9376 times |
Mon 30 June 2025 |
61.17 (-4.18%) |
63.47 |
60.37 - 63.65 |
0.8194 times |
Fri 30 May 2025 |
63.84 (0.46%) |
63.26 |
60.51 - 64.38 |
0.8391 times |
Wed 30 April 2025 |
63.55 (6.72%) |
59.82 |
56.80 - 65.66 |
1.4296 times |
Mon 31 March 2025 |
59.55 (5.21%) |
57.28 |
57.22 - 61.26 |
0.927 times |
Fri 28 February 2025 |
56.60 (-1.36%) |
56.93 |
54.32 - 59.30 |
1.0784 times |
Fri 31 January 2025 |
57.38 (1.2%) |
56.89 |
54.60 - 58.47 |
1.1228 times |
Tue 31 December 2024 |
56.70 (-4.06%) |
58.91 |
56.45 - 59.90 |
0.7942 times |
DMA SMA EMA moving averages of Unilever Plc UL
DMA (daily moving average) of Unilever Plc UL
| DMA period | DMA value | | 5 day DMA | 61.98 | | 12 day DMA | 60.35 | | 20 day DMA | 59.99 | | 35 day DMA | 61.22 | | 50 day DMA | 61.55 | | 100 day DMA | 61.47 | | 150 day DMA | 61.53 | | 200 day DMA | 60.39 | EMA (exponential moving average) of Unilever Plc UL
| EMA period | EMA current | EMA prev | EMA prev2 | | 5 day EMA | 62.05 | 61.63 | 60.89 | | 12 day EMA | 61.05 | 60.72 | 60.28 | | 20 day EMA | 60.82 | 60.6 | 60.34 | | 35 day EMA | 60.95 | 60.84 | 60.71 | | 50 day EMA | 61.54 | 61.49 | 61.42 |
SMA (simple moving average) of Unilever Plc UL
| SMA period | SMA current | SMA prev | SMA prev2 | | 5 day SMA | 61.98 | 61.42 | 60.88 | | 12 day SMA | 60.35 | 60.02 | 59.67 | | 20 day SMA | 59.99 | 59.87 | 59.77 | | 35 day SMA | 61.22 | 61.23 | 61.23 | | 50 day SMA | 61.55 | 61.51 | 61.47 | | 100 day SMA | 61.47 | 61.48 | 61.48 | | 150 day SMA | 61.53 | 61.5 | 61.47 | | 200 day SMA | 60.39 | 60.36 | 60.33 |
|
|
