UrbanEdge UE full analysis,charts,indicators,moving averages,SMA,DMA,EMA,ADX,MACD,RSIUrban Edge UE WideScreen charts, DMA,SMA,EMA technical analysis, forecast prediction, by indicators ADX,MACD,RSI,CCI USA stock exchange
operates under Finance sector & deals in Real Estate
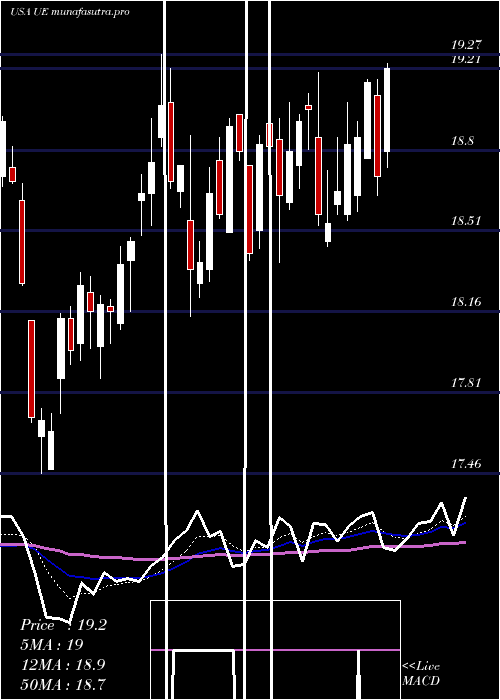
Daily price and charts and targets UrbanEdge Strong Daily Stock price targets for UrbanEdge UE are 19.09 and 19.48 | Daily Target 1 | 18.81 | | Daily Target 2 | 18.97 | | Daily Target 3 | 19.203333333333 | | Daily Target 4 | 19.36 | | Daily Target 5 | 19.59 |
Daily price and volume Urban Edge
| Date |
Closing |
Open |
Range |
Volume |
Thu 04 December 2025 |
19.12 (-0.36%) |
19.11 |
19.05 - 19.44 |
1.0173 times |
Wed 03 December 2025 |
19.19 (0.84%) |
19.15 |
19.00 - 19.24 |
0.8228 times |
Tue 02 December 2025 |
19.03 (-0.94%) |
19.29 |
18.99 - 19.29 |
0.628 times |
Mon 01 December 2025 |
19.21 (-0.05%) |
18.98 |
18.98 - 19.39 |
1.383 times |
Fri 28 November 2025 |
19.22 (-0.05%) |
19.19 |
19.16 - 19.25 |
0.502 times |
Wed 26 November 2025 |
19.23 (-0.05%) |
19.10 |
19.02 - 19.48 |
1.7261 times |
Tue 25 November 2025 |
19.24 (1.64%) |
18.93 |
18.93 - 19.45 |
0.9733 times |
Mon 24 November 2025 |
18.93 (-0.58%) |
18.99 |
18.81 - 19.15 |
0.9136 times |
Fri 21 November 2025 |
19.04 (2.48%) |
18.77 |
18.58 - 19.15 |
1.3251 times |
Thu 20 November 2025 |
18.58 (0.43%) |
18.63 |
18.53 - 19.13 |
0.7089 times |
Wed 19 November 2025 |
18.50 (-1.39%) |
18.71 |
18.46 - 18.93 |
0.7505 times |
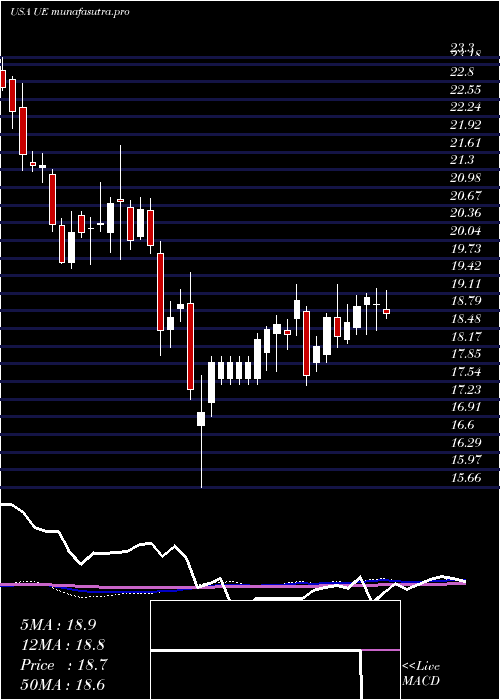
Weekly price and charts UrbanEdge Strong weekly Stock price targets for UrbanEdge UE are 19.05 and 19.51 | Weekly Target 1 | 18.72 | | Weekly Target 2 | 18.92 | | Weekly Target 3 | 19.18 | | Weekly Target 4 | 19.38 | | Weekly Target 5 | 19.64 |
Weekly price and volumes for Urban Edge
| Date |
Closing |
Open |
Range |
Volume |
Thu 04 December 2025 |
19.12 (-0.52%) |
18.98 |
18.98 - 19.44 |
0.8983 times |
Fri 28 November 2025 |
19.22 (0.95%) |
18.99 |
18.81 - 19.48 |
0.9598 times |
Fri 21 November 2025 |
19.04 (0.26%) |
18.95 |
18.46 - 19.15 |
1.1475 times |
Fri 14 November 2025 |
18.99 (-0.78%) |
19.15 |
18.86 - 19.37 |
0.9914 times |
Fri 07 November 2025 |
19.14 (-0.47%) |
19.03 |
18.65 - 19.19 |
1.1037 times |
Fri 31 October 2025 |
19.23 (0%) |
19.26 |
19.12 - 19.35 |
0.3976 times |
Fri 31 October 2025 |
19.23 (-6.1%) |
20.41 |
19.12 - 20.59 |
1.9318 times |
Fri 24 October 2025 |
20.48 (3.02%) |
19.91 |
19.65 - 20.58 |
1.0159 times |
Fri 17 October 2025 |
19.88 (1.07%) |
19.24 |
19.10 - 19.96 |
1.1459 times |
Tue 07 October 2025 |
19.67 (-1.85%) |
20.06 |
19.59 - 20.14 |
0.4081 times |
Fri 03 October 2025 |
20.04 (-0.2%) |
20.12 |
19.90 - 20.53 |
1.2508 times |
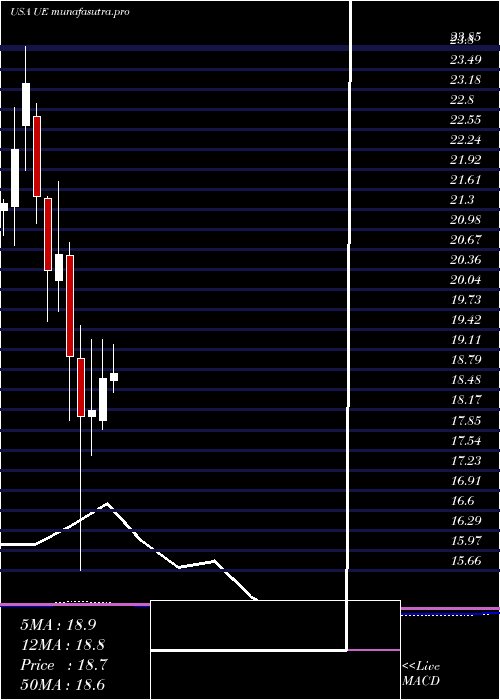
Monthly price and charts UrbanEdge Strong monthly Stock price targets for UrbanEdge UE are 19.05 and 19.51 | Monthly Target 1 | 18.72 | | Monthly Target 2 | 18.92 | | Monthly Target 3 | 19.18 | | Monthly Target 4 | 19.38 | | Monthly Target 5 | 19.64 |
Monthly price and volumes Urban Edge
| Date |
Closing |
Open |
Range |
Volume |
Thu 04 December 2025 |
19.12 (-0.52%) |
18.98 |
18.98 - 19.44 |
0.1483 times |
Fri 28 November 2025 |
19.22 (-0.05%) |
19.03 |
18.46 - 19.48 |
0.6937 times |
Fri 31 October 2025 |
19.23 (-6.06%) |
20.42 |
19.10 - 20.59 |
0.9223 times |
Tue 30 September 2025 |
20.47 (-1.06%) |
20.32 |
19.88 - 21.49 |
1.0947 times |
Fri 29 August 2025 |
20.69 (4.92%) |
19.83 |
19.03 - 20.86 |
1.4419 times |
Thu 31 July 2025 |
19.72 (5.68%) |
18.63 |
18.44 - 20.90 |
1.2375 times |
Mon 30 June 2025 |
18.66 (2.75%) |
18.01 |
17.87 - 19.27 |
1.0823 times |
Fri 30 May 2025 |
18.16 (0.5%) |
18.07 |
17.46 - 19.27 |
0.8944 times |
Wed 30 April 2025 |
18.07 (-4.89%) |
18.97 |
15.66 - 19.48 |
1.4799 times |
Mon 31 March 2025 |
19.00 (-7.77%) |
20.58 |
18.00 - 20.79 |
1.005 times |
Fri 28 February 2025 |
20.60 (1.28%) |
20.19 |
19.71 - 21.73 |
0.8676 times |
DMA SMA EMA moving averages of Urban Edge UE
DMA (daily moving average) of Urban Edge UE
| DMA period | DMA value | | 5 day DMA | 19.15 | | 12 day DMA | 19 | | 20 day DMA | 18.99 | | 35 day DMA | 19.34 | | 50 day DMA | 19.54 | | 100 day DMA | 19.81 | | 150 day DMA | 19.38 | | 200 day DMA | 19.24 | EMA (exponential moving average) of Urban Edge UE
| EMA period | EMA current | EMA prev | EMA prev2 | | 5 day EMA | 19.13 | 19.13 | 19.1 | | 12 day EMA | 19.09 | 19.08 | 19.06 | | 20 day EMA | 19.13 | 19.13 | 19.12 | | 35 day EMA | 19.34 | 19.35 | 19.36 | | 50 day EMA | 19.59 | 19.61 | 19.63 |
SMA (simple moving average) of Urban Edge UE
| SMA period | SMA current | SMA prev | SMA prev2 | | 5 day SMA | 19.15 | 19.18 | 19.19 | | 12 day SMA | 19 | 18.96 | 18.94 | | 20 day SMA | 18.99 | 18.97 | 18.97 | | 35 day SMA | 19.34 | 19.36 | 19.37 | | 50 day SMA | 19.54 | 19.57 | 19.6 | | 100 day SMA | 19.81 | 19.81 | 19.8 | | 150 day SMA | 19.38 | 19.37 | 19.37 | | 200 day SMA | 19.24 | 19.24 | 19.26 |
|
|
