TextronInc TXT full analysis,charts,indicators,moving averages,SMA,DMA,EMA,ADX,MACD,RSITextron Inc TXT WideScreen charts, DMA,SMA,EMA technical analysis, forecast prediction, by indicators ADX,MACD,RSI,CCI USA stock exchange
operates under Capital Goods sector & deals in Aerospace
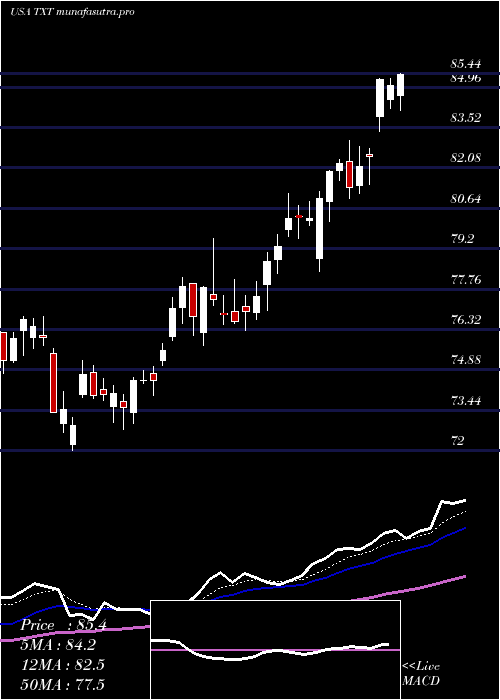
Daily price and charts and targets TextronInc Strong Daily Stock price targets for TextronInc TXT are 82.06 and 83.82 | Daily Target 1 | 81.69 | | Daily Target 2 | 82.42 | | Daily Target 3 | 83.453333333333 | | Daily Target 4 | 84.18 | | Daily Target 5 | 85.21 |
Daily price and volume Textron Inc
| Date |
Closing |
Open |
Range |
Volume |
Thu 04 December 2025 |
83.14 (-0.67%) |
84.00 |
82.73 - 84.49 |
1.5022 times |
Wed 03 December 2025 |
83.70 (1.54%) |
82.70 |
82.46 - 83.82 |
0.8055 times |
Tue 02 December 2025 |
82.43 (0.52%) |
82.41 |
81.54 - 82.63 |
0.8597 times |
Mon 01 December 2025 |
82.00 (-1.39%) |
82.37 |
81.86 - 83.22 |
0.856 times |
Fri 28 November 2025 |
83.16 (0.14%) |
82.93 |
82.81 - 83.38 |
0.5106 times |
Wed 26 November 2025 |
83.04 (0.14%) |
83.13 |
82.95 - 83.70 |
0.7504 times |
Tue 25 November 2025 |
82.92 (0.64%) |
82.68 |
82.39 - 83.29 |
0.9535 times |
Mon 24 November 2025 |
82.39 (1.3%) |
81.25 |
80.64 - 82.95 |
1.6087 times |
Fri 21 November 2025 |
81.33 (2.26%) |
79.67 |
79.39 - 81.91 |
1.0985 times |
Thu 20 November 2025 |
79.53 (-0.31%) |
80.81 |
79.02 - 81.29 |
1.0548 times |
Wed 19 November 2025 |
79.78 (-0.09%) |
79.60 |
79.20 - 80.01 |
1.1011 times |
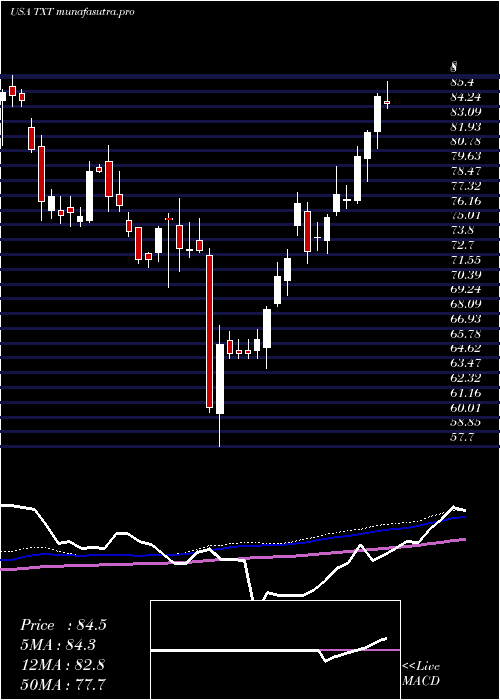
Weekly price and charts TextronInc Strong weekly Stock price targets for TextronInc TXT are 82.34 and 85.29 | Weekly Target 1 | 80.11 | | Weekly Target 2 | 81.62 | | Weekly Target 3 | 83.056666666667 | | Weekly Target 4 | 84.57 | | Weekly Target 5 | 86.01 |
Weekly price and volumes for Textron Inc
| Date |
Closing |
Open |
Range |
Volume |
Thu 04 December 2025 |
83.14 (-0.02%) |
82.37 |
81.54 - 84.49 |
0.8506 times |
Fri 28 November 2025 |
83.16 (2.25%) |
81.25 |
80.64 - 83.70 |
0.8082 times |
Fri 21 November 2025 |
81.33 (0.76%) |
80.76 |
79.02 - 81.91 |
1.021 times |
Fri 14 November 2025 |
80.72 (-1.6%) |
82.06 |
80.39 - 83.30 |
0.9795 times |
Fri 07 November 2025 |
82.03 (1.51%) |
79.44 |
78.84 - 82.09 |
0.8814 times |
Fri 31 October 2025 |
80.81 (0%) |
79.21 |
79.05 - 81.31 |
0.2475 times |
Fri 31 October 2025 |
80.81 (-0.5%) |
81.23 |
79.05 - 81.31 |
1.3962 times |
Fri 24 October 2025 |
81.22 (-0.17%) |
82.03 |
78.12 - 84.12 |
1.9064 times |
Fri 17 October 2025 |
81.36 (-0.21%) |
82.35 |
80.65 - 84.48 |
0.978 times |
Fri 10 October 2025 |
81.53 (-6.13%) |
87.35 |
81.39 - 87.94 |
0.9311 times |
Fri 03 October 2025 |
86.85 (4.02%) |
84.00 |
83.29 - 87.32 |
1.1826 times |
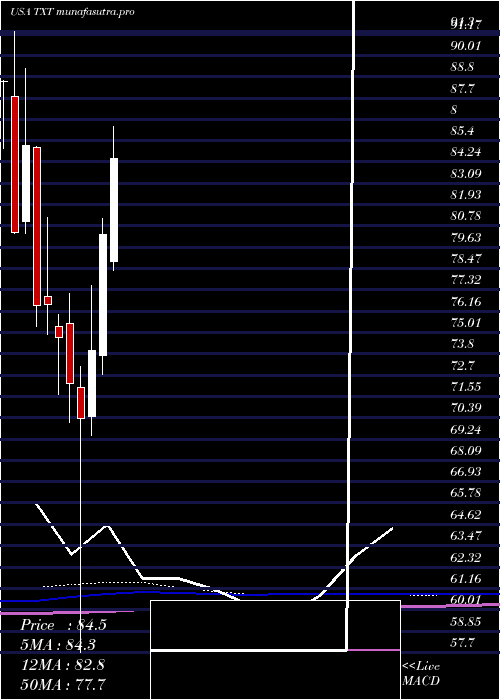
Monthly price and charts TextronInc Strong monthly Stock price targets for TextronInc TXT are 82.34 and 85.29 | Monthly Target 1 | 80.11 | | Monthly Target 2 | 81.62 | | Monthly Target 3 | 83.056666666667 | | Monthly Target 4 | 84.57 | | Monthly Target 5 | 86.01 |
Monthly price and volumes Textron Inc
| Date |
Closing |
Open |
Range |
Volume |
Thu 04 December 2025 |
83.14 (-0.02%) |
82.37 |
81.54 - 84.49 |
0.172 times |
Fri 28 November 2025 |
83.16 (2.91%) |
79.44 |
78.84 - 83.70 |
0.7464 times |
Fri 31 October 2025 |
80.81 (-4.36%) |
84.03 |
78.12 - 87.94 |
1.2466 times |
Tue 30 September 2025 |
84.49 (5.4%) |
79.28 |
78.48 - 84.72 |
1.0711 times |
Fri 29 August 2025 |
80.16 (3.07%) |
76.72 |
75.80 - 82.27 |
0.8768 times |
Thu 31 July 2025 |
77.77 (-3.14%) |
78.86 |
77.16 - 87.80 |
1.4737 times |
Mon 30 June 2025 |
80.29 (8.46%) |
73.77 |
72.76 - 81.16 |
1.0408 times |
Fri 30 May 2025 |
74.03 (5.2%) |
70.47 |
69.46 - 77.57 |
1.0407 times |
Wed 30 April 2025 |
70.37 (-2.6%) |
72.03 |
57.70 - 73.18 |
1.1934 times |
Mon 31 March 2025 |
72.25 (-3.32%) |
75.49 |
70.14 - 77.10 |
1.1385 times |
Fri 28 February 2025 |
74.73 (-2.33%) |
75.33 |
71.67 - 76.01 |
0.8172 times |
DMA SMA EMA moving averages of Textron Inc TXT
DMA (daily moving average) of Textron Inc TXT
| DMA period | DMA value | | 5 day DMA | 82.89 | | 12 day DMA | 81.94 | | 20 day DMA | 81.75 | | 35 day DMA | 81.38 | | 50 day DMA | 82.27 | | 100 day DMA | 81.62 | | 150 day DMA | 80.04 | | 200 day DMA | 77.56 | EMA (exponential moving average) of Textron Inc TXT
| EMA period | EMA current | EMA prev | EMA prev2 | | 5 day EMA | 82.92 | 82.81 | 82.36 | | 12 day EMA | 82.34 | 82.19 | 81.91 | | 20 day EMA | 82.04 | 81.92 | 81.73 | | 35 day EMA | 82.2 | 82.14 | 82.05 | | 50 day EMA | 82.42 | 82.39 | 82.34 |
SMA (simple moving average) of Textron Inc TXT
| SMA period | SMA current | SMA prev | SMA prev2 | | 5 day SMA | 82.89 | 82.87 | 82.71 | | 12 day SMA | 81.94 | 81.68 | 81.43 | | 20 day SMA | 81.75 | 81.6 | 81.41 | | 35 day SMA | 81.38 | 81.36 | 81.36 | | 50 day SMA | 82.27 | 82.27 | 82.25 | | 100 day SMA | 81.62 | 81.63 | 81.65 | | 150 day SMA | 80.04 | 79.95 | 79.86 | | 200 day SMA | 77.56 | 77.5 | 77.45 |
|
|
