TexasRoadhouse TXRH full analysis,charts,indicators,moving averages,SMA,DMA,EMA,ADX,MACD,RSITexas Roadhouse TXRH WideScreen charts, DMA,SMA,EMA technical analysis, forecast prediction, by indicators ADX,MACD,RSI,CCI USA stock exchange
operates under Consumer Services sector & deals in Restaurants
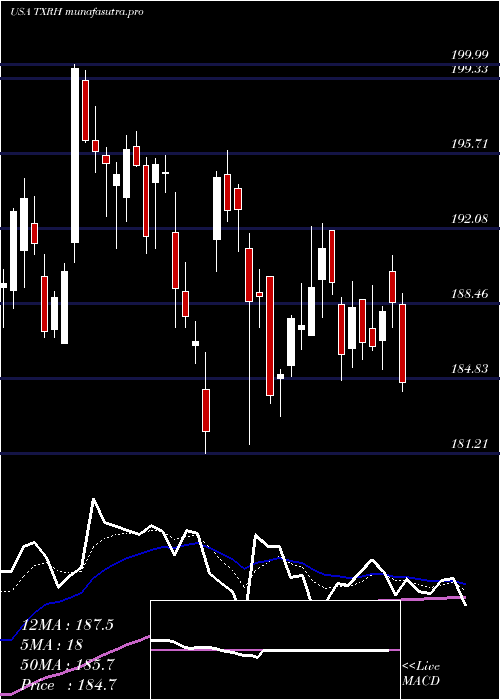
Daily price and charts and targets TexasRoadhouse Strong Daily Stock price targets for TexasRoadhouse TXRH are 177.62 and 180.64 | Daily Target 1 | 175.12 | | Daily Target 2 | 177.09 | | Daily Target 3 | 178.13666666667 | | Daily Target 4 | 180.11 | | Daily Target 5 | 181.16 |
Daily price and volume Texas Roadhouse
| Date |
Closing |
Open |
Range |
Volume |
Mon 20 October 2025 |
179.07 (0.5%) |
177.72 |
176.16 - 179.18 |
0.6575 times |
Fri 17 October 2025 |
178.18 (3.15%) |
168.75 |
168.75 - 181.00 |
1.1083 times |
Thu 16 October 2025 |
172.74 (0.12%) |
172.47 |
170.82 - 173.14 |
0.6477 times |
Wed 15 October 2025 |
172.53 (1.59%) |
170.00 |
170.00 - 174.00 |
0.6648 times |
Tue 14 October 2025 |
169.83 (-1.24%) |
171.15 |
169.63 - 171.89 |
1.5249 times |
Mon 13 October 2025 |
171.96 (5.28%) |
164.91 |
163.52 - 172.63 |
1.5383 times |
Fri 10 October 2025 |
163.33 (-2.63%) |
167.54 |
163.25 - 168.52 |
0.9964 times |
Thu 09 October 2025 |
167.75 (1.13%) |
165.92 |
165.89 - 168.86 |
0.847 times |
Wed 08 October 2025 |
165.87 (-0.41%) |
166.75 |
164.63 - 167.54 |
1.0645 times |
Tue 07 October 2025 |
166.56 (-0.33%) |
166.02 |
164.42 - 167.35 |
0.9506 times |
Mon 06 October 2025 |
167.11 (0.37%) |
166.30 |
164.91 - 167.60 |
0.9447 times |
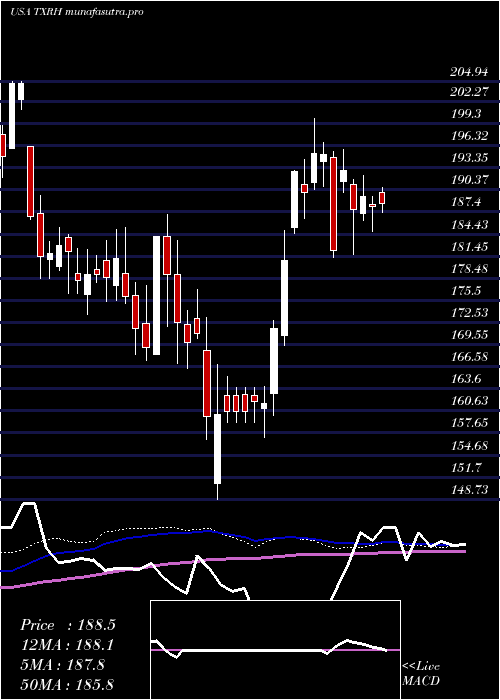
Weekly price and charts TexasRoadhouse Strong weekly Stock price targets for TexasRoadhouse TXRH are 177.62 and 180.64 | Weekly Target 1 | 175.12 | | Weekly Target 2 | 177.09 | | Weekly Target 3 | 178.13666666667 | | Weekly Target 4 | 180.11 | | Weekly Target 5 | 181.16 |
Weekly price and volumes for Texas Roadhouse
| Date |
Closing |
Open |
Range |
Volume |
Mon 20 October 2025 |
179.07 (0.5%) |
177.72 |
176.16 - 179.18 |
0.146 times |
Fri 17 October 2025 |
178.18 (9.09%) |
164.91 |
163.52 - 181.00 |
1.2174 times |
Fri 10 October 2025 |
163.33 (-1.9%) |
166.30 |
163.25 - 168.86 |
1.0662 times |
Fri 03 October 2025 |
166.49 (2.44%) |
163.15 |
160.63 - 166.92 |
1.256 times |
Fri 26 September 2025 |
162.53 (2.71%) |
158.10 |
157.93 - 164.02 |
1.3293 times |
Fri 19 September 2025 |
158.24 (-5.07%) |
167.26 |
157.48 - 168.42 |
1.4905 times |
Fri 12 September 2025 |
166.69 (-1.28%) |
168.51 |
163.89 - 168.83 |
1.1256 times |
Fri 05 September 2025 |
168.85 (-2.14%) |
170.66 |
162.96 - 172.54 |
1.0368 times |
Fri 29 August 2025 |
172.55 (0%) |
172.50 |
171.51 - 173.87 |
0.1886 times |
Fri 29 August 2025 |
172.55 (-2.7%) |
177.44 |
171.04 - 178.58 |
1.1438 times |
Fri 22 August 2025 |
177.33 (2.6%) |
173.07 |
172.02 - 177.59 |
1.1609 times |
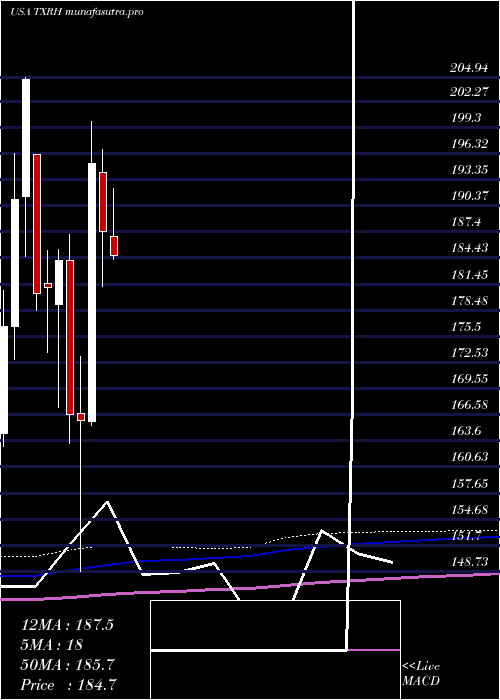
Monthly price and charts TexasRoadhouse Strong monthly Stock price targets for TexasRoadhouse TXRH are 169.85 and 190.22 | Monthly Target 1 | 153.2 | | Monthly Target 2 | 166.13 | | Monthly Target 3 | 173.56666666667 | | Monthly Target 4 | 186.5 | | Monthly Target 5 | 193.94 |
Monthly price and volumes Texas Roadhouse
| Date |
Closing |
Open |
Range |
Volume |
Mon 20 October 2025 |
179.07 (7.78%) |
165.26 |
160.63 - 181.00 |
0.6454 times |
Tue 30 September 2025 |
166.15 (-3.71%) |
170.66 |
157.48 - 172.54 |
1.1801 times |
Fri 29 August 2025 |
172.55 (-6.8%) |
184.15 |
170.18 - 185.97 |
1.116 times |
Thu 31 July 2025 |
185.13 (-1.22%) |
186.91 |
181.32 - 192.32 |
0.7506 times |
Mon 30 June 2025 |
187.41 (-4%) |
194.18 |
181.21 - 196.77 |
0.8975 times |
Fri 30 May 2025 |
195.21 (17.62%) |
165.83 |
165.36 - 199.99 |
1.082 times |
Wed 30 April 2025 |
165.96 (-0.4%) |
166.75 |
148.73 - 173.20 |
1.1517 times |
Mon 31 March 2025 |
166.63 (-9.48%) |
184.10 |
163.32 - 187.06 |
1.0484 times |
Fri 28 February 2025 |
184.09 (1.65%) |
179.13 |
167.35 - 185.35 |
1.277 times |
Fri 31 January 2025 |
181.10 (0.37%) |
181.58 |
173.65 - 185.25 |
0.8514 times |
Tue 31 December 2024 |
180.43 (-11.86%) |
196.24 |
178.41 - 196.24 |
0.4055 times |
DMA SMA EMA moving averages of Texas Roadhouse TXRH
DMA (daily moving average) of Texas Roadhouse TXRH
| DMA period | DMA value | | 5 day DMA | 174.47 | | 12 day DMA | 170.12 | | 20 day DMA | 167.46 | | 35 day DMA | 166.81 | | 50 day DMA | 169.08 | | 100 day DMA | 178.39 | | 150 day DMA | 176.13 | | 200 day DMA | 176.67 | EMA (exponential moving average) of Texas Roadhouse TXRH
| EMA period | EMA current | EMA prev | EMA prev2 | | 5 day EMA | 175.18 | 173.23 | 170.75 | | 12 day EMA | 171.38 | 169.98 | 168.49 | | 20 day EMA | 169.63 | 168.64 | 167.64 | | 35 day EMA | 169.78 | 169.23 | 168.7 | | 50 day EMA | 170.54 | 170.19 | 169.86 |
SMA (simple moving average) of Texas Roadhouse TXRH
| SMA period | SMA current | SMA prev | SMA prev2 | | 5 day SMA | 174.47 | 173.05 | 170.08 | | 12 day SMA | 170.12 | 168.95 | 167.67 | | 20 day SMA | 167.46 | 166.48 | 165.48 | | 35 day SMA | 166.81 | 166.62 | 166.46 | | 50 day SMA | 169.08 | 169 | 168.89 | | 100 day SMA | 178.39 | 178.59 | 178.71 | | 150 day SMA | 176.13 | 176.06 | 176.04 | | 200 day SMA | 176.67 | 176.68 | 176.69 |
|
|
