TexasInstruments TXN full analysis,charts,indicators,moving averages,SMA,DMA,EMA,ADX,MACD,RSITexas Instruments TXN WideScreen charts, DMA,SMA,EMA technical analysis, forecast prediction, by indicators ADX,MACD,RSI,CCI USA stock exchange
operates under Technology sector & deals in Semiconductors
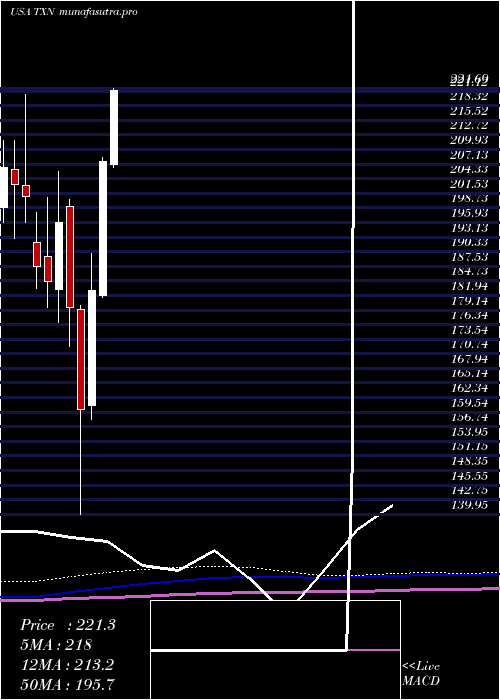
Daily price and charts and targets TexasInstruments Strong Daily Stock price targets for TexasInstruments TXN are 179.84 and 182.84 | Daily Target 1 | 177.51 | | Daily Target 2 | 179.17 | | Daily Target 3 | 180.50666666667 | | Daily Target 4 | 182.17 | | Daily Target 5 | 183.51 |
Daily price and volume Texas Instruments
| Date |
Closing |
Open |
Range |
Volume |
Tue 21 October 2025 |
180.84 (0.7%) |
179.47 |
178.84 - 181.84 |
1.4478 times |
Mon 20 October 2025 |
179.58 (1.5%) |
175.51 |
172.51 - 181.11 |
0.4486 times |
Fri 17 October 2025 |
176.93 (1.34%) |
173.68 |
173.68 - 177.63 |
0.4931 times |
Thu 16 October 2025 |
174.59 (-0.39%) |
175.47 |
174.06 - 177.50 |
0.7297 times |
Wed 15 October 2025 |
175.27 (0.76%) |
174.02 |
171.13 - 176.16 |
1.3234 times |
Tue 14 October 2025 |
173.94 (-0.67%) |
171.97 |
171.45 - 176.27 |
1.3941 times |
Mon 13 October 2025 |
175.11 (1.99%) |
172.83 |
172.40 - 176.10 |
1.2101 times |
Fri 10 October 2025 |
171.70 (-4.06%) |
179.62 |
171.50 - 181.57 |
1.3534 times |
Thu 09 October 2025 |
178.96 (-1.45%) |
180.49 |
177.62 - 180.70 |
0.7035 times |
Wed 08 October 2025 |
181.60 (2.57%) |
176.83 |
176.83 - 181.93 |
0.8963 times |
Tue 07 October 2025 |
177.05 (-2.45%) |
181.76 |
176.96 - 182.02 |
0.7584 times |
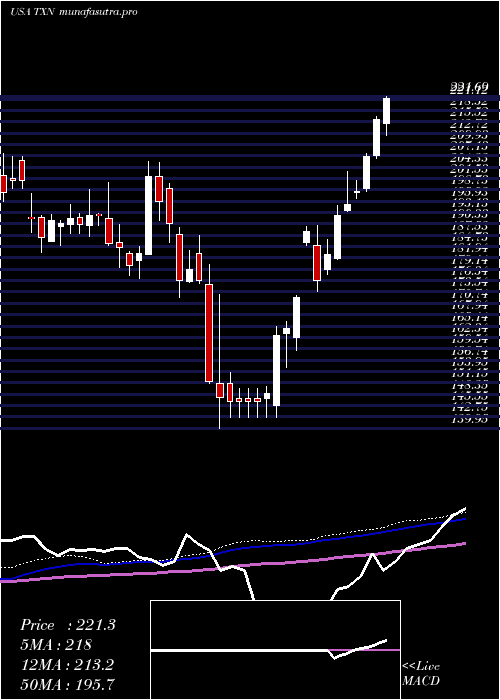
Weekly price and charts TexasInstruments Strong weekly Stock price targets for TexasInstruments TXN are 176.68 and 186.01 | Weekly Target 1 | 169.07 | | Weekly Target 2 | 174.95 | | Weekly Target 3 | 178.39666666667 | | Weekly Target 4 | 184.28 | | Weekly Target 5 | 187.73 |
Weekly price and volumes for Texas Instruments
| Date |
Closing |
Open |
Range |
Volume |
Tue 21 October 2025 |
180.84 (2.21%) |
175.51 |
172.51 - 181.84 |
0.4763 times |
Fri 17 October 2025 |
176.93 (3.05%) |
172.83 |
171.13 - 177.63 |
1.2937 times |
Fri 10 October 2025 |
171.70 (-4.8%) |
181.20 |
171.50 - 183.23 |
1.074 times |
Fri 03 October 2025 |
180.35 (-2.28%) |
185.47 |
178.33 - 186.10 |
0.8767 times |
Fri 26 September 2025 |
184.55 (2.89%) |
179.40 |
179.30 - 187.29 |
1.0267 times |
Fri 19 September 2025 |
179.37 (-1.77%) |
175.88 |
174.01 - 183.72 |
1.7977 times |
Fri 12 September 2025 |
182.60 (-2.84%) |
188.15 |
182.26 - 188.37 |
1.2239 times |
Fri 05 September 2025 |
187.93 (-7.19%) |
199.38 |
181.69 - 200.17 |
1.2039 times |
Fri 29 August 2025 |
202.48 (0%) |
203.51 |
201.56 - 204.05 |
0.1897 times |
Fri 29 August 2025 |
202.48 (-1.74%) |
206.00 |
201.56 - 207.41 |
0.8374 times |
Fri 22 August 2025 |
206.06 (5.91%) |
194.57 |
193.45 - 209.09 |
0.9824 times |
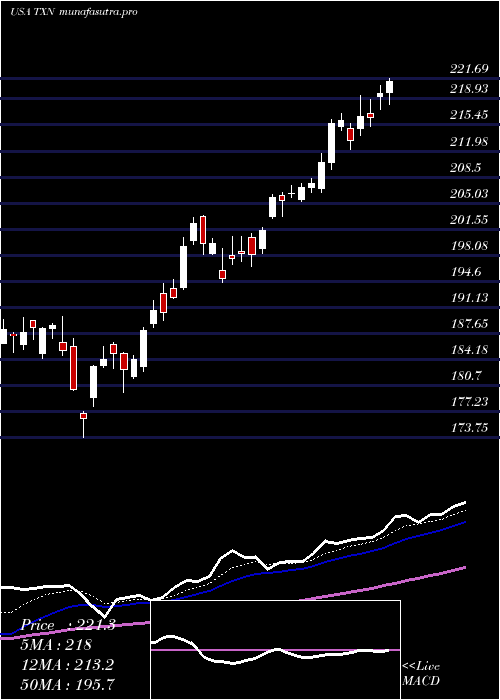
Monthly price and charts TexasInstruments Strong monthly Stock price targets for TexasInstruments TXN are 168.82 and 183.15 | Monthly Target 1 | 164.81 | | Monthly Target 2 | 172.83 | | Monthly Target 3 | 179.14333333333 | | Monthly Target 4 | 187.16 | | Monthly Target 5 | 193.47 |
Monthly price and volumes Texas Instruments
| Date |
Closing |
Open |
Range |
Volume |
Tue 21 October 2025 |
180.84 (-1.57%) |
181.97 |
171.13 - 185.46 |
0.6865 times |
Tue 30 September 2025 |
183.73 (-9.26%) |
199.38 |
174.01 - 200.17 |
1.123 times |
Fri 29 August 2025 |
202.48 (11.83%) |
179.63 |
177.92 - 209.09 |
0.8549 times |
Thu 31 July 2025 |
181.06 (-12.79%) |
207.00 |
179.81 - 221.69 |
1.1662 times |
Mon 30 June 2025 |
207.62 (13.55%) |
181.85 |
181.61 - 208.38 |
0.7949 times |
Fri 30 May 2025 |
182.85 (14.25%) |
160.84 |
158.06 - 189.90 |
1.0979 times |
Wed 30 April 2025 |
160.05 (-10.93%) |
179.28 |
139.95 - 179.93 |
1.5316 times |
Mon 31 March 2025 |
179.70 (-8.31%) |
199.01 |
172.09 - 200.25 |
0.8412 times |
Fri 28 February 2025 |
195.99 (6.16%) |
183.03 |
176.76 - 205.75 |
0.8289 times |
Fri 31 January 2025 |
184.61 (-1.55%) |
189.32 |
179.61 - 200.64 |
1.0748 times |
Tue 31 December 2024 |
187.51 (-6.69%) |
192.03 |
183.35 - 197.81 |
0.5268 times |
DMA SMA EMA moving averages of Texas Instruments TXN
DMA (daily moving average) of Texas Instruments TXN
| DMA period | DMA value | | 5 day DMA | 177.44 | | 12 day DMA | 177.26 | | 20 day DMA | 179.42 | | 35 day DMA | 181.14 | | 50 day DMA | 186.91 | | 100 day DMA | 193.4 | | 150 day DMA | 184.71 | | 200 day DMA | 185.67 | EMA (exponential moving average) of Texas Instruments TXN
| EMA period | EMA current | EMA prev | EMA prev2 | | 5 day EMA | 178.31 | 177.05 | 175.79 | | 12 day EMA | 178.07 | 177.57 | 177.21 | | 20 day EMA | 179.21 | 179.04 | 178.98 | | 35 day EMA | 182.68 | 182.79 | 182.98 | | 50 day EMA | 186.02 | 186.23 | 186.5 |
SMA (simple moving average) of Texas Instruments TXN
| SMA period | SMA current | SMA prev | SMA prev2 | | 5 day SMA | 177.44 | 176.06 | 175.17 | | 12 day SMA | 177.26 | 177.22 | 177.46 | | 20 day SMA | 179.42 | 179.48 | 179.48 | | 35 day SMA | 181.14 | 181.68 | 182.34 | | 50 day SMA | 186.91 | 187.15 | 187.24 | | 100 day SMA | 193.4 | 193.43 | 193.47 | | 150 day SMA | 184.71 | 184.7 | 184.68 | | 200 day SMA | 185.67 | 185.72 | 185.75 |
|
|
