TaiwanFund TWN full analysis,charts,indicators,moving averages,SMA,DMA,EMA,ADX,MACD,RSITaiwan Fund TWN WideScreen charts, DMA,SMA,EMA technical analysis, forecast prediction, by indicators ADX,MACD,RSI,CCI USA stock exchange
operates under N A sector & deals in N A
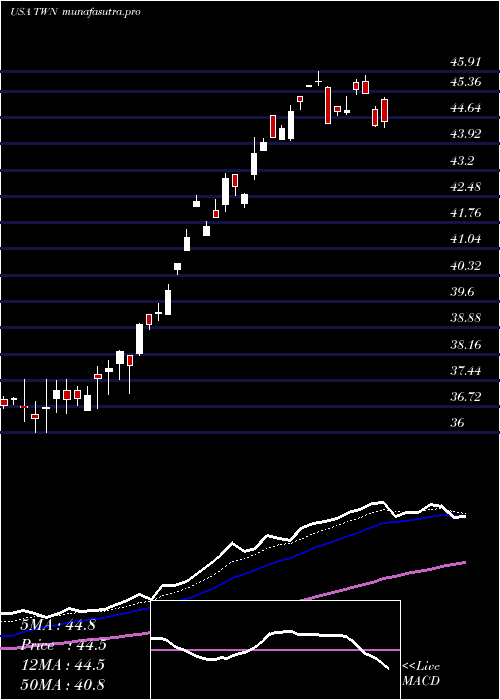
Daily price and charts and targets TaiwanFund Strong Daily Stock price targets for TaiwanFund TWN are 53.69 and 55.92 | Daily Target 1 | 53.31 | | Daily Target 2 | 54.07 | | Daily Target 3 | 55.536666666667 | | Daily Target 4 | 56.3 | | Daily Target 5 | 57.77 |
Daily price and volume Taiwan Fund
| Date |
Closing |
Open |
Range |
Volume |
Fri 17 October 2025 |
54.84 (-1.03%) |
55.49 |
54.77 - 57.00 |
1.8684 times |
Thu 16 October 2025 |
55.41 (-0.45%) |
56.10 |
54.63 - 56.41 |
0.9148 times |
Wed 15 October 2025 |
55.66 (1.87%) |
54.81 |
54.63 - 56.47 |
0.8445 times |
Tue 14 October 2025 |
54.64 (-1.32%) |
53.91 |
52.21 - 55.30 |
1.418 times |
Mon 13 October 2025 |
55.37 (2.14%) |
55.01 |
55.01 - 56.93 |
1.9387 times |
Fri 10 October 2025 |
54.21 (-1.83%) |
55.80 |
52.25 - 55.85 |
0.5735 times |
Thu 09 October 2025 |
55.22 (-1%) |
55.50 |
55.14 - 55.62 |
0.3694 times |
Wed 08 October 2025 |
55.78 (1.42%) |
54.30 |
54.30 - 56.48 |
0.4539 times |
Tue 07 October 2025 |
55.00 (-0.65%) |
55.12 |
54.71 - 56.88 |
0.9289 times |
Mon 06 October 2025 |
55.36 (1.21%) |
54.22 |
54.22 - 57.01 |
0.6899 times |
Fri 03 October 2025 |
54.70 (0.55%) |
55.55 |
54.49 - 55.55 |
0.4222 times |
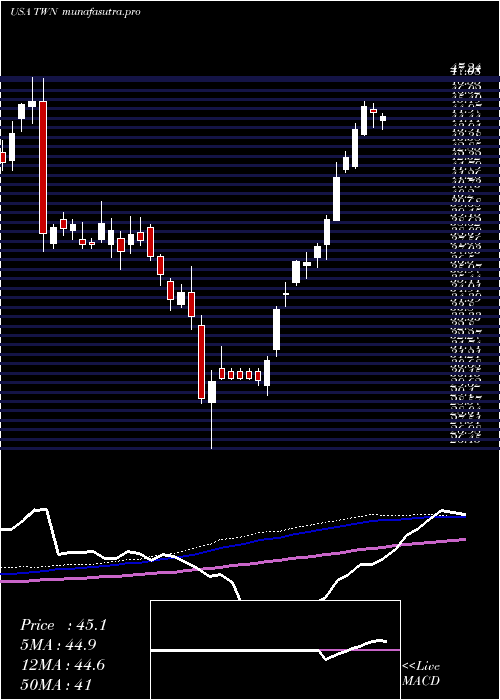
Weekly price and charts TaiwanFund Strong weekly Stock price targets for TaiwanFund TWN are 51.13 and 55.92 | Weekly Target 1 | 49.89 | | Weekly Target 2 | 52.37 | | Weekly Target 3 | 54.683333333333 | | Weekly Target 4 | 57.16 | | Weekly Target 5 | 59.47 |
Weekly price and volumes for Taiwan Fund
| Date |
Closing |
Open |
Range |
Volume |
Fri 17 October 2025 |
54.84 (1.16%) |
55.01 |
52.21 - 57.00 |
2.8257 times |
Fri 10 October 2025 |
54.21 (-0.9%) |
54.22 |
52.25 - 57.01 |
1.22 times |
Fri 03 October 2025 |
54.70 (3.4%) |
52.90 |
52.00 - 55.55 |
1.6482 times |
Fri 26 September 2025 |
52.90 (-3.56%) |
54.51 |
52.68 - 55.55 |
1.0135 times |
Fri 19 September 2025 |
54.85 (2.29%) |
53.95 |
53.00 - 54.95 |
0.4114 times |
Fri 12 September 2025 |
53.62 (4.93%) |
51.99 |
51.62 - 54.30 |
0.4726 times |
Fri 05 September 2025 |
51.10 (1.69%) |
50.58 |
50.16 - 52.31 |
0.7473 times |
Fri 29 August 2025 |
50.25 (0%) |
49.56 |
49.56 - 50.35 |
0.1096 times |
Fri 29 August 2025 |
50.25 (2.76%) |
48.42 |
47.98 - 50.49 |
0.7061 times |
Fri 22 August 2025 |
48.90 (1.24%) |
48.79 |
47.76 - 49.10 |
0.8456 times |
Fri 15 August 2025 |
48.30 (1.53%) |
47.90 |
47.72 - 48.67 |
0.3032 times |
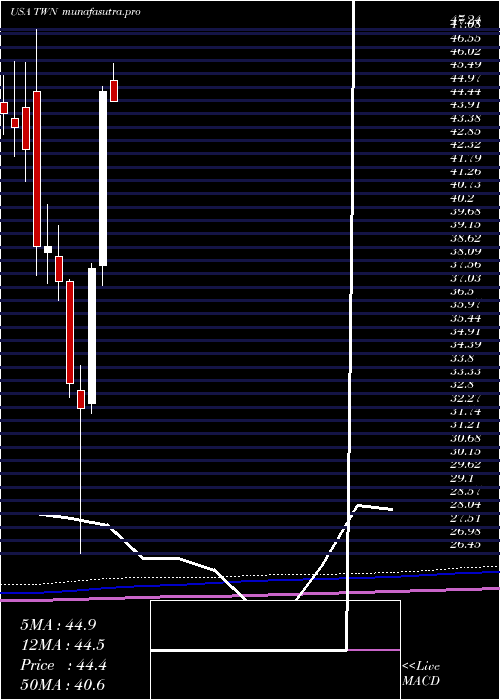
Monthly price and charts TaiwanFund Strong monthly Stock price targets for TaiwanFund TWN are 53.53 and 58.33 | Monthly Target 1 | 49.89 | | Monthly Target 2 | 52.36 | | Monthly Target 3 | 54.686666666667 | | Monthly Target 4 | 57.16 | | Monthly Target 5 | 59.49 |
Monthly price and volumes Taiwan Fund
| Date |
Closing |
Open |
Range |
Volume |
Fri 17 October 2025 |
54.84 (1.33%) |
54.44 |
52.21 - 57.01 |
0.9866 times |
Tue 30 September 2025 |
54.12 (7.7%) |
50.58 |
50.16 - 55.55 |
0.5908 times |
Fri 29 August 2025 |
50.25 (9.74%) |
46.17 |
45.87 - 50.49 |
0.4589 times |
Thu 31 July 2025 |
45.79 (2.19%) |
45.22 |
44.36 - 46.33 |
0.5938 times |
Mon 30 June 2025 |
44.81 (18.64%) |
37.90 |
37.08 - 44.98 |
0.5741 times |
Fri 30 May 2025 |
37.77 (17.3%) |
32.42 |
32.02 - 37.98 |
1.6119 times |
Wed 30 April 2025 |
32.20 (-3.04%) |
32.91 |
26.45 - 33.94 |
1.1767 times |
Mon 31 March 2025 |
33.21 (-10.82%) |
37.25 |
32.64 - 37.35 |
1.6534 times |
Fri 28 February 2025 |
37.24 (-3.67%) |
38.23 |
36.52 - 39.46 |
1.1326 times |
Fri 31 January 2025 |
38.66 (0.03%) |
38.41 |
37.19 - 40.33 |
1.2213 times |
Tue 31 December 2024 |
38.65 (-9.08%) |
44.79 |
37.51 - 47.24 |
1.7286 times |
DMA SMA EMA moving averages of Taiwan Fund TWN
DMA (daily moving average) of Taiwan Fund TWN
| DMA period | DMA value | | 5 day DMA | 55.18 | | 12 day DMA | 55.05 | | 20 day DMA | 54.69 | | 35 day DMA | 53.81 | | 50 day DMA | 52.38 | | 100 day DMA | 47.89 | | 150 day DMA | 42.95 | | 200 day DMA | 41.65 | EMA (exponential moving average) of Taiwan Fund TWN
| EMA period | EMA current | EMA prev | EMA prev2 | | 5 day EMA | 55.11 | 55.24 | 55.15 | | 12 day EMA | 54.92 | 54.94 | 54.86 | | 20 day EMA | 54.53 | 54.5 | 54.4 | | 35 day EMA | 53.38 | 53.29 | 53.16 | | 50 day EMA | 52.2 | 52.09 | 51.95 |
SMA (simple moving average) of Taiwan Fund TWN
| SMA period | SMA current | SMA prev | SMA prev2 | | 5 day SMA | 55.18 | 55.06 | 55.02 | | 12 day SMA | 55.05 | 55.04 | 54.94 | | 20 day SMA | 54.69 | 54.69 | 54.64 | | 35 day SMA | 53.81 | 53.68 | 53.53 | | 50 day SMA | 52.38 | 52.24 | 52.07 | | 100 day SMA | 47.89 | 47.71 | 47.52 | | 150 day SMA | 42.95 | 42.82 | 42.68 | | 200 day SMA | 41.65 | 41.57 | 41.49 |
|
|
