TitanInternational TWI full analysis,charts,indicators,moving averages,SMA,DMA,EMA,ADX,MACD,RSITitan International TWI WideScreen charts, DMA,SMA,EMA technical analysis, forecast prediction, by indicators ADX,MACD,RSI,CCI USA stock exchange
operates under Basic Industries sector & deals in Steel Iron Ore
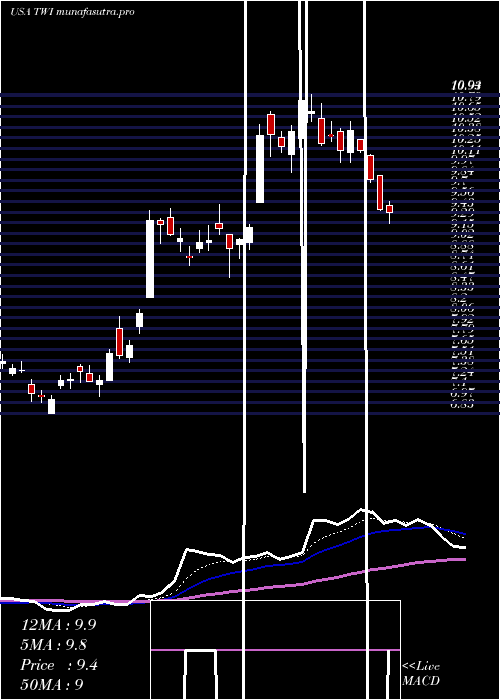
Daily price and charts and targets TitanInternational Strong Daily Stock price targets for TitanInternational TWI are 7.35 and 7.52 | Daily Target 1 | 7.31 | | Daily Target 2 | 7.38 | | Daily Target 3 | 7.4833333333333 | | Daily Target 4 | 7.55 | | Daily Target 5 | 7.65 |
Daily price and volume Titan International
| Date |
Closing |
Open |
Range |
Volume |
Mon 20 October 2025 |
7.44 (0.95%) |
7.46 |
7.42 - 7.59 |
0.7255 times |
Fri 17 October 2025 |
7.37 (-0.27%) |
7.34 |
7.26 - 7.44 |
1.2119 times |
Thu 16 October 2025 |
7.39 (-1.34%) |
7.47 |
7.24 - 7.53 |
1.3555 times |
Wed 15 October 2025 |
7.49 (0%) |
7.57 |
7.43 - 7.74 |
0.7889 times |
Tue 14 October 2025 |
7.49 (1.22%) |
7.22 |
7.22 - 7.58 |
0.7677 times |
Mon 13 October 2025 |
7.40 (1.09%) |
7.46 |
7.31 - 7.49 |
0.8082 times |
Fri 10 October 2025 |
7.32 (-3.3%) |
7.53 |
7.30 - 7.73 |
1.1133 times |
Thu 09 October 2025 |
7.57 (-3.32%) |
7.80 |
7.57 - 7.82 |
0.8477 times |
Wed 08 October 2025 |
7.83 (0%) |
7.91 |
7.77 - 8.07 |
1.081 times |
Tue 07 October 2025 |
7.83 (-0.38%) |
7.87 |
7.75 - 7.93 |
1.3004 times |
Mon 06 October 2025 |
7.86 (-5.53%) |
8.35 |
7.82 - 8.38 |
1.2752 times |
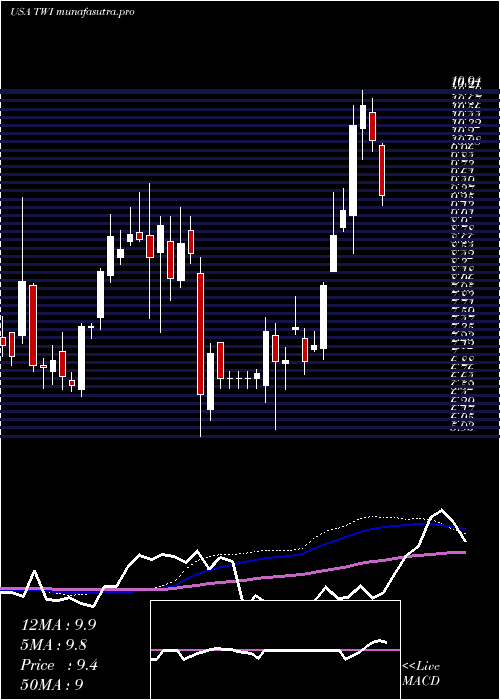
Weekly price and charts TitanInternational Strong weekly Stock price targets for TitanInternational TWI are 7.35 and 7.52 | Weekly Target 1 | 7.31 | | Weekly Target 2 | 7.38 | | Weekly Target 3 | 7.4833333333333 | | Weekly Target 4 | 7.55 | | Weekly Target 5 | 7.65 |
Weekly price and volumes for Titan International
| Date |
Closing |
Open |
Range |
Volume |
Mon 20 October 2025 |
7.44 (0.95%) |
7.46 |
7.42 - 7.59 |
0.1444 times |
Fri 17 October 2025 |
7.37 (0.68%) |
7.46 |
7.22 - 7.74 |
0.9814 times |
Fri 10 October 2025 |
7.32 (-12.02%) |
8.35 |
7.30 - 8.38 |
1.1178 times |
Fri 03 October 2025 |
8.32 (8.19%) |
7.74 |
7.37 - 8.42 |
1.6496 times |
Fri 26 September 2025 |
7.69 (-5.76%) |
8.15 |
7.38 - 8.22 |
1.8836 times |
Fri 19 September 2025 |
8.16 (-5.56%) |
8.73 |
8.06 - 9.03 |
1.7 times |
Fri 12 September 2025 |
8.64 (-1.71%) |
8.83 |
8.33 - 8.92 |
0.9045 times |
Fri 05 September 2025 |
8.79 (-0.34%) |
8.60 |
8.53 - 9.02 |
0.6142 times |
Fri 29 August 2025 |
8.82 (0%) |
8.95 |
8.70 - 8.95 |
0.1767 times |
Fri 29 August 2025 |
8.82 (-3.92%) |
9.14 |
8.70 - 9.23 |
0.828 times |
Fri 22 August 2025 |
9.18 (7.87%) |
8.53 |
8.38 - 9.28 |
0.8356 times |
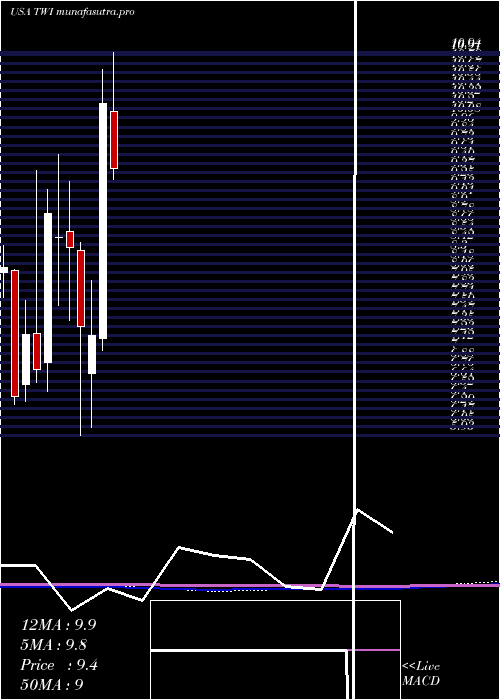
Monthly price and charts TitanInternational Strong monthly Stock price targets for TitanInternational TWI are 6.73 and 7.93 | Monthly Target 1 | 6.49 | | Monthly Target 2 | 6.97 | | Monthly Target 3 | 7.6933333333333 | | Monthly Target 4 | 8.17 | | Monthly Target 5 | 8.89 |
Monthly price and volumes Titan International
| Date |
Closing |
Open |
Range |
Volume |
Mon 20 October 2025 |
7.44 (-1.59%) |
7.56 |
7.22 - 8.42 |
0.5392 times |
Tue 30 September 2025 |
7.56 (-14.29%) |
8.60 |
7.37 - 9.03 |
0.9877 times |
Fri 29 August 2025 |
8.82 (4.26%) |
8.26 |
8.07 - 9.28 |
0.6813 times |
Thu 31 July 2025 |
8.46 (-17.62%) |
10.17 |
8.03 - 10.94 |
0.9123 times |
Mon 30 June 2025 |
10.27 (41.85%) |
7.20 |
7.04 - 10.72 |
1.0506 times |
Fri 30 May 2025 |
7.24 (-1.5%) |
6.74 |
6.03 - 7.96 |
0.9101 times |
Wed 30 April 2025 |
7.35 (-12.4%) |
8.35 |
5.93 - 8.45 |
1.0313 times |
Mon 31 March 2025 |
8.39 (-1.53%) |
8.60 |
7.43 - 9.25 |
1.4597 times |
Fri 28 February 2025 |
8.52 (-3.51%) |
8.52 |
7.63 - 9.60 |
1.1342 times |
Fri 31 January 2025 |
8.83 (30.04%) |
6.88 |
6.51 - 9.15 |
1.2937 times |
Tue 31 December 2024 |
6.79 (-6.34%) |
7.27 |
6.62 - 9.39 |
1.5749 times |
DMA SMA EMA moving averages of Titan International TWI
DMA (daily moving average) of Titan International TWI
| DMA period | DMA value | | 5 day DMA | 7.44 | | 12 day DMA | 7.61 | | 20 day DMA | 7.61 | | 35 day DMA | 8.03 | | 50 day DMA | 8.26 | | 100 day DMA | 8.69 | | 150 day DMA | 8.24 | | 200 day DMA | 8.23 | EMA (exponential moving average) of Titan International TWI
| EMA period | EMA current | EMA prev | EMA prev2 | | 5 day EMA | 7.44 | 7.44 | 7.47 | | 12 day EMA | 7.54 | 7.56 | 7.6 | | 20 day EMA | 7.69 | 7.72 | 7.76 | | 35 day EMA | 7.93 | 7.96 | 7.99 | | 50 day EMA | 8.19 | 8.22 | 8.25 |
SMA (simple moving average) of Titan International TWI
| SMA period | SMA current | SMA prev | SMA prev2 | | 5 day SMA | 7.44 | 7.43 | 7.42 | | 12 day SMA | 7.61 | 7.64 | 7.65 | | 20 day SMA | 7.61 | 7.64 | 7.68 | | 35 day SMA | 8.03 | 8.07 | 8.11 | | 50 day SMA | 8.26 | 8.27 | 8.29 | | 100 day SMA | 8.69 | 8.69 | 8.69 | | 150 day SMA | 8.24 | 8.25 | 8.25 | | 200 day SMA | 8.23 | 8.23 | 8.22 |
|
|
