TennesseeValley TVC full analysis,charts,indicators,moving averages,SMA,DMA,EMA,ADX,MACD,RSITennessee Valley TVC WideScreen charts, DMA,SMA,EMA technical analysis, forecast prediction, by indicators ADX,MACD,RSI,CCI USA stock exchange
operates under Public Utilities sector & deals in Electric Utilities Central
Daily price and charts and targets TennesseeValley Strong Daily Stock price targets for TennesseeValley TVC are 24.13 and 24.22 | Daily Target 1 | 24.06 | | Daily Target 2 | 24.11 | | Daily Target 3 | 24.15 | | Daily Target 4 | 24.2 | | Daily Target 5 | 24.24 |
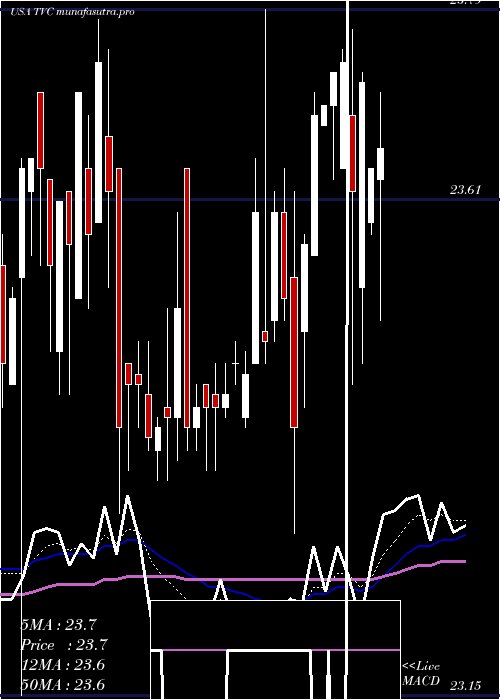
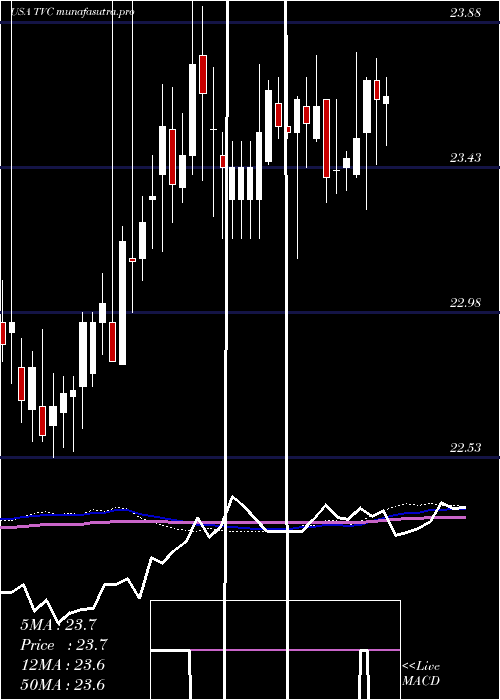
Daily price and volume Tennessee Valley
| Date |
Closing |
Open |
Range |
Volume |
Fri 05 December 2025 |
24.16 (-0.33%) |
24.14 |
24.10 - 24.19 |
0.4621 times |
Thu 04 December 2025 |
24.24 (0.37%) |
24.10 |
24.06 - 24.24 |
0.333 times |
Wed 03 December 2025 |
24.15 (0%) |
24.15 |
24.05 - 24.20 |
3.9619 times |
Tue 02 December 2025 |
24.15 (0.33%) |
24.14 |
24.06 - 24.15 |
2.3649 times |
Mon 01 December 2025 |
24.07 (-0.21%) |
24.18 |
24.05 - 24.25 |
0.1631 times |
Fri 28 November 2025 |
24.12 (0.08%) |
24.06 |
24.04 - 24.13 |
1.247 times |
Wed 26 November 2025 |
24.10 (-0.41%) |
24.13 |
24.07 - 24.20 |
0.2175 times |
Tue 25 November 2025 |
24.20 (-0.04%) |
24.20 |
24.10 - 24.20 |
0.3738 times |
Mon 24 November 2025 |
24.21 (0.33%) |
24.15 |
24.11 - 24.21 |
0.7271 times |
Fri 21 November 2025 |
24.13 (-0.04%) |
24.19 |
24.04 - 24.19 |
0.1495 times |
Thu 20 November 2025 |
24.14 (0%) |
24.12 |
24.08 - 24.14 |
0.2922 times |
Weekly price and charts TennesseeValley Strong weekly Stock price targets for TennesseeValley TVC are 24.01 and 24.21 | Weekly Target 1 | 23.95 | | Weekly Target 2 | 24.06 | | Weekly Target 3 | 24.153333333333 | | Weekly Target 4 | 24.26 | | Weekly Target 5 | 24.35 |
Weekly price and volumes for Tennessee Valley
| Date |
Closing |
Open |
Range |
Volume |
Fri 05 December 2025 |
24.16 (0.17%) |
24.18 |
24.05 - 24.25 |
2.8706 times |
Fri 28 November 2025 |
24.12 (-0.04%) |
24.15 |
24.04 - 24.21 |
1.0109 times |
Fri 21 November 2025 |
24.13 (0.04%) |
24.11 |
24.01 - 24.21 |
0.8047 times |
Fri 14 November 2025 |
24.12 (0.12%) |
24.06 |
23.98 - 24.22 |
1.2465 times |
Fri 07 November 2025 |
24.09 (0.67%) |
24.13 |
23.98 - 24.13 |
1.2626 times |
Fri 31 October 2025 |
23.93 (0%) |
24.00 |
23.90 - 24.13 |
0.4927 times |
Fri 31 October 2025 |
23.93 (-0.66%) |
24.04 |
23.90 - 24.17 |
0.9894 times |
Fri 24 October 2025 |
24.09 (0.21%) |
24.04 |
24.04 - 24.33 |
0.4914 times |
Fri 17 October 2025 |
24.04 (-0.46%) |
24.01 |
23.90 - 24.15 |
0.5744 times |
Tue 07 October 2025 |
24.15 (0.62%) |
24.03 |
23.91 - 24.18 |
0.2568 times |
Fri 03 October 2025 |
24.00 (0.59%) |
24.01 |
23.83 - 24.15 |
1.152 times |
Monthly price and charts TennesseeValley Strong monthly Stock price targets for TennesseeValley TVC are 24.01 and 24.21 | Monthly Target 1 | 23.95 | | Monthly Target 2 | 24.06 | | Monthly Target 3 | 24.153333333333 | | Monthly Target 4 | 24.26 | | Monthly Target 5 | 24.35 |
Monthly price and volumes Tennessee Valley
| Date |
Closing |
Open |
Range |
Volume |
Fri 05 December 2025 |
24.16 (0.17%) |
24.18 |
24.05 - 24.25 |
0.5576 times |
Fri 28 November 2025 |
24.12 (0.79%) |
24.13 |
23.98 - 24.22 |
0.84 times |
Fri 31 October 2025 |
23.93 (0.29%) |
23.93 |
23.86 - 24.33 |
0.6252 times |
Tue 30 September 2025 |
23.86 (0.8%) |
23.69 |
23.56 - 24.25 |
0.783 times |
Fri 29 August 2025 |
23.67 (-0.92%) |
23.85 |
23.47 - 24.02 |
1.1552 times |
Thu 31 July 2025 |
23.89 (2.09%) |
23.49 |
23.42 - 23.89 |
0.663 times |
Mon 30 June 2025 |
23.40 (-0.93%) |
23.64 |
23.30 - 23.79 |
1.4033 times |
Fri 30 May 2025 |
23.62 (-0.25%) |
23.71 |
23.15 - 23.84 |
0.9108 times |
Wed 30 April 2025 |
23.68 (-0.38%) |
23.77 |
23.21 - 23.77 |
0.8442 times |
Mon 31 March 2025 |
23.77 (1.84%) |
23.41 |
23.17 - 24.05 |
2.2177 times |
Fri 28 February 2025 |
23.34 (2.23%) |
22.82 |
22.82 - 24.00 |
1.2002 times |
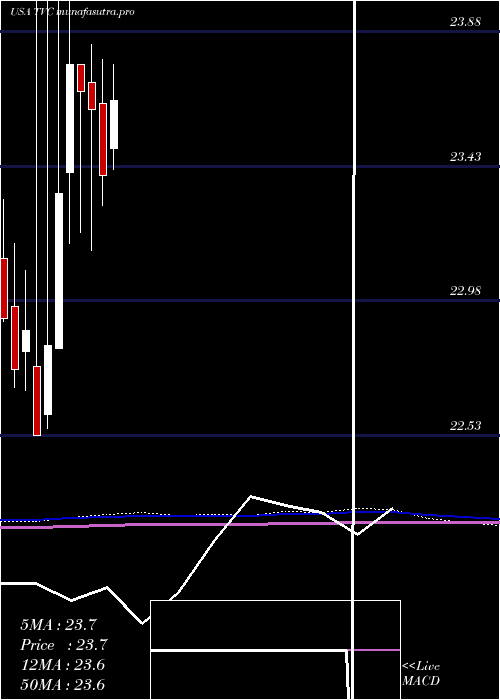
DMA SMA EMA moving averages of Tennessee Valley TVC
DMA (daily moving average) of Tennessee Valley TVC
| DMA period | DMA value | | 5 day DMA | 24.15 | | 12 day DMA | 24.15 | | 20 day DMA | 24.13 | | 35 day DMA | 24.1 | | 50 day DMA | 24.07 | | 100 day DMA | 23.96 | | 150 day DMA | 23.82 | | 200 day DMA | 23.73 | EMA (exponential moving average) of Tennessee Valley TVC
| EMA period | EMA current | EMA prev | EMA prev2 | | 5 day EMA | 24.17 | 24.17 | 24.14 | | 12 day EMA | 24.14 | 24.14 | 24.12 | | 20 day EMA | 24.11 | 24.11 | 24.1 | | 35 day EMA | 24.09 | 24.09 | 24.08 | | 50 day EMA | 24.08 | 24.08 | 24.07 |
SMA (simple moving average) of Tennessee Valley TVC
| SMA period | SMA current | SMA prev | SMA prev2 | | 5 day SMA | 24.15 | 24.15 | 24.12 | | 12 day SMA | 24.15 | 24.15 | 24.14 | | 20 day SMA | 24.13 | 24.12 | 24.11 | | 35 day SMA | 24.1 | 24.09 | 24.09 | | 50 day SMA | 24.07 | 24.07 | 24.07 | | 100 day SMA | 23.96 | 23.95 | 23.95 | | 150 day SMA | 23.82 | 23.82 | 23.82 | | 200 day SMA | 23.73 | 23.73 | 23.72 |
|
|
