MammothEnergy TUSK full analysis,charts,indicators,moving averages,SMA,DMA,EMA,ADX,MACD,RSIMammoth Energy TUSK WideScreen charts, DMA,SMA,EMA technical analysis, forecast prediction, by indicators ADX,MACD,RSI,CCI USA stock exchange
operates under Energy sector & deals in Oilfield Services Equipment
Daily price and charts and targets MammothEnergy Strong Daily Stock price targets for MammothEnergy TUSK are 2.2 and 2.24 | Daily Target 1 | 2.19 | | Daily Target 2 | 2.2 | | Daily Target 3 | 2.2266666666667 | | Daily Target 4 | 2.24 | | Daily Target 5 | 2.27 |
Daily price and volume Mammoth Energy
| Date |
Closing |
Open |
Range |
Volume |
Mon 20 October 2025 |
2.22 (0%) |
2.23 |
2.21 - 2.25 |
0.5243 times |
Fri 17 October 2025 |
2.22 (-0.45%) |
2.23 |
2.20 - 2.25 |
0.6312 times |
Thu 16 October 2025 |
2.23 (-1.76%) |
2.26 |
2.22 - 2.29 |
0.5549 times |
Wed 15 October 2025 |
2.27 (-0.87%) |
2.30 |
2.23 - 2.30 |
0.6436 times |
Tue 14 October 2025 |
2.29 (2.23%) |
2.20 |
2.19 - 2.31 |
0.8947 times |
Mon 13 October 2025 |
2.24 (3.23%) |
2.22 |
2.15 - 2.29 |
1.0903 times |
Fri 10 October 2025 |
2.17 (-4.82%) |
2.26 |
2.15 - 2.30 |
2.8659 times |
Thu 09 October 2025 |
2.28 (-2.15%) |
2.33 |
2.27 - 2.33 |
0.8642 times |
Wed 08 October 2025 |
2.33 (2.19%) |
2.29 |
2.27 - 2.34 |
1.0875 times |
Tue 07 October 2025 |
2.28 (-0.87%) |
2.30 |
2.28 - 2.35 |
0.8434 times |
Mon 06 October 2025 |
2.30 (0%) |
2.31 |
2.28 - 2.34 |
1.6174 times |
Weekly price and charts MammothEnergy Strong weekly Stock price targets for MammothEnergy TUSK are 2.2 and 2.24 | Weekly Target 1 | 2.19 | | Weekly Target 2 | 2.2 | | Weekly Target 3 | 2.2266666666667 | | Weekly Target 4 | 2.24 | | Weekly Target 5 | 2.27 |
Weekly price and volumes for Mammoth Energy
| Date |
Closing |
Open |
Range |
Volume |
Mon 20 October 2025 |
2.22 (0%) |
2.23 |
2.21 - 2.25 |
0.1005 times |
Fri 17 October 2025 |
2.22 (2.3%) |
2.22 |
2.15 - 2.31 |
0.7313 times |
Fri 10 October 2025 |
2.17 (-5.65%) |
2.31 |
2.15 - 2.35 |
1.3953 times |
Fri 03 October 2025 |
2.30 (-5.35%) |
2.43 |
2.23 - 2.43 |
2 times |
Fri 26 September 2025 |
2.43 (5.65%) |
2.31 |
2.29 - 2.54 |
1.1987 times |
Fri 19 September 2025 |
2.30 (-2.95%) |
2.36 |
2.29 - 2.42 |
2.0329 times |
Fri 12 September 2025 |
2.37 (3.49%) |
2.30 |
2.26 - 2.40 |
0.8448 times |
Fri 05 September 2025 |
2.29 (-3.38%) |
2.36 |
2.28 - 2.39 |
0.794 times |
Fri 29 August 2025 |
2.37 (0%) |
2.35 |
2.35 - 2.38 |
0.125 times |
Fri 29 August 2025 |
2.37 (-0.42%) |
2.36 |
2.31 - 2.45 |
0.7775 times |
Fri 22 August 2025 |
2.38 (6.25%) |
2.25 |
2.22 - 2.42 |
1.3828 times |
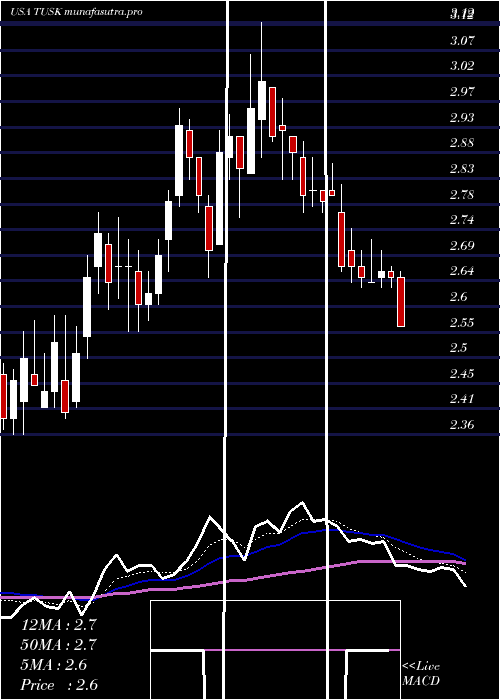
Monthly price and charts MammothEnergy Strong monthly Stock price targets for MammothEnergy TUSK are 2.09 and 2.29 | Monthly Target 1 | 2.04 | | Monthly Target 2 | 2.13 | | Monthly Target 3 | 2.24 | | Monthly Target 4 | 2.33 | | Monthly Target 5 | 2.44 |
Monthly price and volumes Mammoth Energy
| Date |
Closing |
Open |
Range |
Volume |
Mon 20 October 2025 |
2.22 (-3.06%) |
2.30 |
2.15 - 2.35 |
0.542 times |
Tue 30 September 2025 |
2.29 (-3.38%) |
2.36 |
2.26 - 2.54 |
0.9085 times |
Fri 29 August 2025 |
2.37 (-8.85%) |
2.58 |
2.11 - 2.59 |
0.8981 times |
Thu 31 July 2025 |
2.60 (-7.14%) |
2.81 |
2.50 - 2.87 |
0.7075 times |
Mon 30 June 2025 |
2.80 (6.06%) |
2.67 |
2.55 - 3.12 |
1.0358 times |
Fri 30 May 2025 |
2.64 (4.35%) |
2.53 |
2.36 - 2.81 |
1.2065 times |
Wed 30 April 2025 |
2.53 (24.02%) |
2.04 |
1.68 - 2.75 |
2.4792 times |
Mon 31 March 2025 |
2.04 (-16.73%) |
2.46 |
1.91 - 2.62 |
1.0248 times |
Fri 28 February 2025 |
2.45 (-18.06%) |
2.90 |
2.28 - 3.17 |
0.5547 times |
Fri 31 January 2025 |
2.99 (-0.33%) |
3.07 |
2.83 - 3.52 |
0.643 times |
Tue 31 December 2024 |
3.00 (-18.03%) |
3.25 |
2.59 - 3.35 |
0.7511 times |
DMA SMA EMA moving averages of Mammoth Energy TUSK
DMA (daily moving average) of Mammoth Energy TUSK
| DMA period | DMA value | | 5 day DMA | 2.25 | | 12 day DMA | 2.26 | | 20 day DMA | 2.31 | | 35 day DMA | 2.32 | | 50 day DMA | 2.32 | | 100 day DMA | 2.51 | | 150 day DMA | 2.47 | | 200 day DMA | 2.55 | EMA (exponential moving average) of Mammoth Energy TUSK
| EMA period | EMA current | EMA prev | EMA prev2 | | 5 day EMA | 2.23 | 2.24 | 2.25 | | 12 day EMA | 2.25 | 2.26 | 2.27 | | 20 day EMA | 2.27 | 2.28 | 2.29 | | 35 day EMA | 2.31 | 2.32 | 2.33 | | 50 day EMA | 2.34 | 2.34 | 2.34 |
SMA (simple moving average) of Mammoth Energy TUSK
| SMA period | SMA current | SMA prev | SMA prev2 | | 5 day SMA | 2.25 | 2.25 | 2.24 | | 12 day SMA | 2.26 | 2.27 | 2.27 | | 20 day SMA | 2.31 | 2.31 | 2.31 | | 35 day SMA | 2.32 | 2.32 | 2.33 | | 50 day SMA | 2.32 | 2.32 | 2.32 | | 100 day SMA | 2.51 | 2.51 | 2.51 | | 150 day SMA | 2.47 | 2.47 | 2.47 | | 200 day SMA | 2.55 | 2.55 | 2.56 |
|
|
