TelusCorporation TU full analysis,charts,indicators,moving averages,SMA,DMA,EMA,ADX,MACD,RSITelus Corporation TU WideScreen charts, DMA,SMA,EMA technical analysis, forecast prediction, by indicators ADX,MACD,RSI,CCI USA stock exchange
operates under Public Utilities sector & deals in Telecommunications Equipment
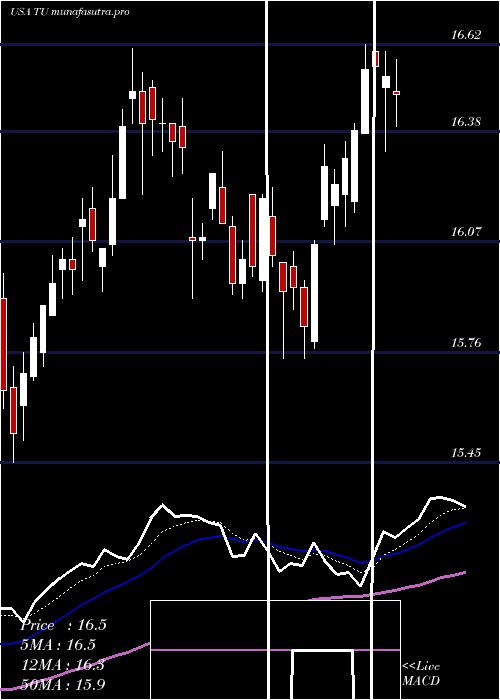
Daily price and charts and targets TelusCorporation Strong Daily Stock price targets for TelusCorporation TU are 13.27 and 13.45 | Daily Target 1 | 13.23 | | Daily Target 2 | 13.3 | | Daily Target 3 | 13.413333333333 | | Daily Target 4 | 13.48 | | Daily Target 5 | 13.59 |
Daily price and volume Telus Corporation
| Date |
Closing |
Open |
Range |
Volume |
Thu 04 December 2025 |
13.36 (0.6%) |
13.41 |
13.35 - 13.53 |
0.8644 times |
Wed 03 December 2025 |
13.28 (1.61%) |
13.19 |
13.11 - 13.61 |
2.0495 times |
Tue 02 December 2025 |
13.07 (1.24%) |
12.95 |
12.91 - 13.07 |
0.5812 times |
Mon 01 December 2025 |
12.91 (-1.83%) |
13.07 |
12.80 - 13.11 |
1.2621 times |
Fri 28 November 2025 |
13.15 (1.31%) |
13.08 |
13.05 - 13.19 |
0.4796 times |
Wed 26 November 2025 |
12.98 (0.08%) |
12.97 |
12.91 - 13.07 |
0.9629 times |
Tue 25 November 2025 |
12.97 (-0.08%) |
13.01 |
12.87 - 13.10 |
0.9021 times |
Mon 24 November 2025 |
12.98 (-2.26%) |
13.25 |
12.93 - 13.30 |
1.1426 times |
Fri 21 November 2025 |
13.28 (-0.67%) |
13.36 |
13.26 - 13.46 |
0.997 times |
Thu 20 November 2025 |
13.37 (-0.89%) |
13.52 |
13.33 - 13.56 |
0.7586 times |
Wed 19 November 2025 |
13.49 (-0.74%) |
13.66 |
13.30 - 13.74 |
1.1899 times |
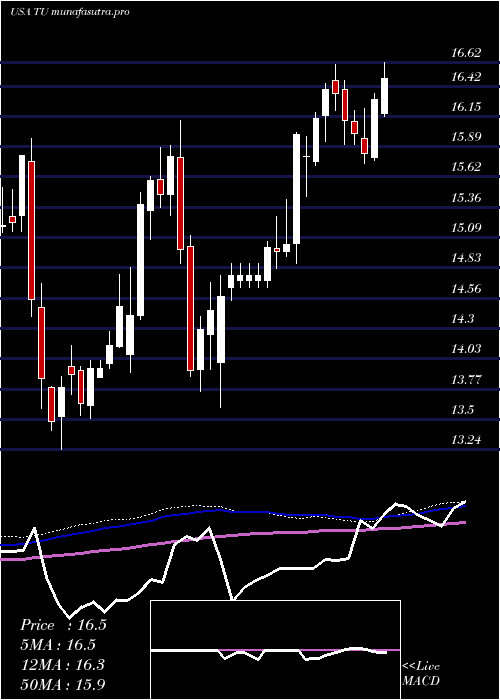
Weekly price and charts TelusCorporation Strong weekly Stock price targets for TelusCorporation TU are 13.08 and 13.89 | Weekly Target 1 | 12.45 | | Weekly Target 2 | 12.9 | | Weekly Target 3 | 13.256666666667 | | Weekly Target 4 | 13.71 | | Weekly Target 5 | 14.07 |
Weekly price and volumes for Telus Corporation
| Date |
Closing |
Open |
Range |
Volume |
Thu 04 December 2025 |
13.36 (1.6%) |
13.07 |
12.80 - 13.61 |
1.426 times |
Fri 28 November 2025 |
13.15 (-0.98%) |
13.25 |
12.87 - 13.30 |
1.0453 times |
Fri 21 November 2025 |
13.28 (-8.73%) |
14.56 |
13.26 - 14.56 |
1.6329 times |
Fri 14 November 2025 |
14.55 (-1.69%) |
14.80 |
14.52 - 14.95 |
1.0903 times |
Fri 07 November 2025 |
14.80 (0.95%) |
14.57 |
14.43 - 14.81 |
1.105 times |
Fri 31 October 2025 |
14.66 (0%) |
14.62 |
14.58 - 14.71 |
0.1847 times |
Fri 31 October 2025 |
14.66 (-2.66%) |
15.07 |
14.58 - 15.07 |
0.9885 times |
Fri 24 October 2025 |
15.06 (-1.76%) |
15.37 |
15.00 - 15.41 |
0.7068 times |
Fri 17 October 2025 |
15.33 (0.59%) |
15.24 |
14.85 - 15.40 |
1.0246 times |
Fri 10 October 2025 |
15.24 (-2.87%) |
15.59 |
15.14 - 15.63 |
0.7959 times |
Fri 03 October 2025 |
15.69 (0.06%) |
15.72 |
15.54 - 15.88 |
0.5801 times |
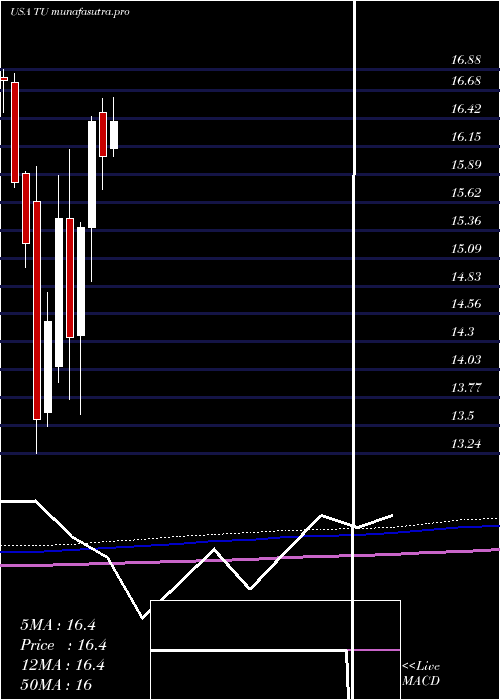
Monthly price and charts TelusCorporation Strong monthly Stock price targets for TelusCorporation TU are 13.08 and 13.89 | Monthly Target 1 | 12.45 | | Monthly Target 2 | 12.9 | | Monthly Target 3 | 13.256666666667 | | Monthly Target 4 | 13.71 | | Monthly Target 5 | 14.07 |
Monthly price and volumes Telus Corporation
| Date |
Closing |
Open |
Range |
Volume |
Thu 04 December 2025 |
13.36 (1.6%) |
13.07 |
12.80 - 13.61 |
0.5028 times |
Fri 28 November 2025 |
13.15 (-10.3%) |
14.57 |
12.87 - 14.95 |
1.7183 times |
Fri 31 October 2025 |
14.66 (-7.04%) |
15.75 |
14.58 - 15.88 |
1.4172 times |
Tue 30 September 2025 |
15.77 (-4.37%) |
16.45 |
15.61 - 16.65 |
1.0175 times |
Fri 29 August 2025 |
16.49 (2.42%) |
16.23 |
15.60 - 16.72 |
0.846 times |
Thu 31 July 2025 |
16.10 (0.25%) |
16.13 |
16.06 - 16.74 |
0.9207 times |
Mon 30 June 2025 |
16.06 (-2.01%) |
16.47 |
15.74 - 16.61 |
0.7602 times |
Fri 30 May 2025 |
16.39 (6.57%) |
15.38 |
14.87 - 16.44 |
0.8254 times |
Wed 30 April 2025 |
15.38 (7.25%) |
14.36 |
13.61 - 15.43 |
1.0073 times |
Mon 31 March 2025 |
14.34 (-7.3%) |
15.47 |
13.75 - 16.12 |
0.9846 times |
Fri 28 February 2025 |
15.47 (6.76%) |
14.07 |
13.91 - 15.88 |
0.9576 times |
DMA SMA EMA moving averages of Telus Corporation TU
DMA (daily moving average) of Telus Corporation TU
| DMA period | DMA value | | 5 day DMA | 13.15 | | 12 day DMA | 13.2 | | 20 day DMA | 13.78 | | 35 day DMA | 14.27 | | 50 day DMA | 14.63 | | 100 day DMA | 15.43 | | 150 day DMA | 15.63 | | 200 day DMA | 15.45 | EMA (exponential moving average) of Telus Corporation TU
| EMA period | EMA current | EMA prev | EMA prev2 | | 5 day EMA | 13.22 | 13.15 | 13.08 | | 12 day EMA | 13.38 | 13.38 | 13.4 | | 20 day EMA | 13.67 | 13.7 | 13.74 | | 35 day EMA | 14.12 | 14.17 | 14.22 | | 50 day EMA | 14.58 | 14.63 | 14.68 |
SMA (simple moving average) of Telus Corporation TU
| SMA period | SMA current | SMA prev | SMA prev2 | | 5 day SMA | 13.15 | 13.08 | 13.02 | | 12 day SMA | 13.2 | 13.28 | 13.39 | | 20 day SMA | 13.78 | 13.84 | 13.91 | | 35 day SMA | 14.27 | 14.32 | 14.37 | | 50 day SMA | 14.63 | 14.68 | 14.73 | | 100 day SMA | 15.43 | 15.46 | 15.49 | | 150 day SMA | 15.63 | 15.64 | 15.65 | | 200 day SMA | 15.45 | 15.46 | 15.47 |
|
|
