TakeTwo TTWO full analysis,charts,indicators,moving averages,SMA,DMA,EMA,ADX,MACD,RSITake Two TTWO WideScreen charts, DMA,SMA,EMA technical analysis, forecast prediction, by indicators ADX,MACD,RSI,CCI USA stock exchange
operates under Technology sector & deals in Computer Software Prepackaged Software
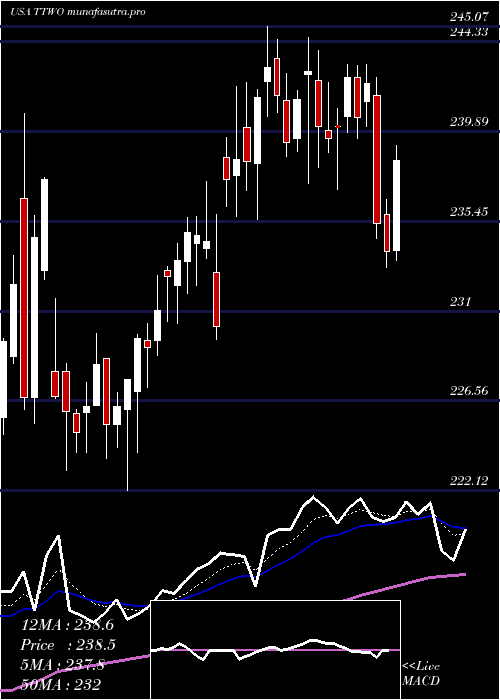
Daily price and charts and targets TakeTwo Strong Daily Stock price targets for TakeTwo TTWO are 257.37 and 261.24 | Daily Target 1 | 256.4 | | Daily Target 2 | 258.34 | | Daily Target 3 | 260.27 | | Daily Target 4 | 262.21 | | Daily Target 5 | 264.14 |
Daily price and volume Take Two
| Date |
Closing |
Open |
Range |
Volume |
Tue 21 October 2025 |
260.28 (-0.77%) |
261.29 |
258.33 - 262.20 |
0.8072 times |
Mon 20 October 2025 |
262.29 (0.36%) |
262.22 |
260.37 - 262.95 |
1.1809 times |
Fri 17 October 2025 |
261.35 (0.82%) |
259.23 |
258.22 - 263.00 |
0.8828 times |
Thu 16 October 2025 |
259.23 (-0.87%) |
262.72 |
257.54 - 264.34 |
1.1694 times |
Wed 15 October 2025 |
261.50 (1.47%) |
259.42 |
259.38 - 264.79 |
1.168 times |
Tue 14 October 2025 |
257.72 (0.41%) |
256.99 |
254.55 - 260.73 |
0.793 times |
Mon 13 October 2025 |
256.68 (1.87%) |
253.30 |
251.50 - 257.42 |
0.8207 times |
Fri 10 October 2025 |
251.97 (-1.84%) |
256.09 |
250.95 - 258.14 |
1.1898 times |
Thu 09 October 2025 |
256.69 (-0.53%) |
259.34 |
255.86 - 259.38 |
0.8136 times |
Wed 08 October 2025 |
258.07 (-0.93%) |
261.11 |
255.57 - 262.19 |
1.1745 times |
Tue 07 October 2025 |
260.50 (0.97%) |
257.50 |
257.50 - 261.09 |
1.2189 times |
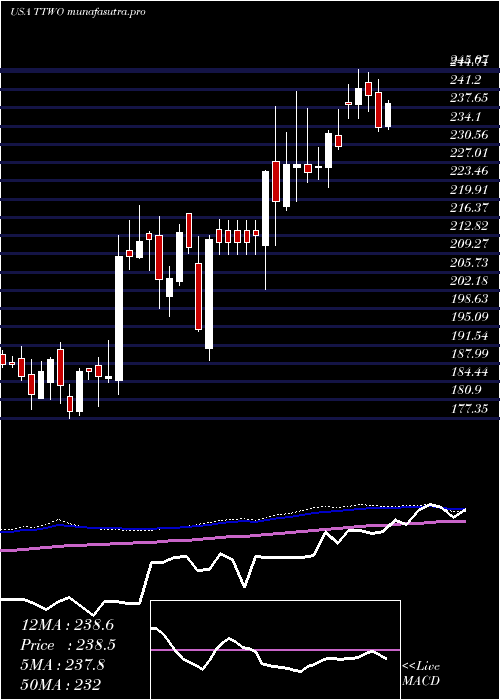
Weekly price and charts TakeTwo Strong weekly Stock price targets for TakeTwo TTWO are 257 and 261.62 | Weekly Target 1 | 255.9 | | Weekly Target 2 | 258.09 | | Weekly Target 3 | 260.52 | | Weekly Target 4 | 262.71 | | Weekly Target 5 | 265.14 |
Weekly price and volumes for Take Two
| Date |
Closing |
Open |
Range |
Volume |
Tue 21 October 2025 |
260.28 (-0.41%) |
262.22 |
258.33 - 262.95 |
0.3658 times |
Fri 17 October 2025 |
261.35 (3.72%) |
253.30 |
251.50 - 264.79 |
0.8895 times |
Fri 10 October 2025 |
251.97 (-2.22%) |
259.01 |
250.95 - 262.19 |
0.9432 times |
Fri 03 October 2025 |
257.68 (0.61%) |
257.57 |
252.55 - 261.47 |
1.4359 times |
Fri 26 September 2025 |
256.12 (2.1%) |
249.39 |
239.46 - 258.10 |
1.6096 times |
Fri 19 September 2025 |
250.85 (1.86%) |
246.25 |
245.70 - 252.61 |
1.7146 times |
Fri 12 September 2025 |
246.26 (2.75%) |
241.78 |
241.40 - 250.45 |
1.0225 times |
Fri 05 September 2025 |
239.68 (2.75%) |
231.16 |
229.33 - 242.69 |
0.8048 times |
Fri 29 August 2025 |
233.27 (0%) |
234.28 |
232.60 - 235.99 |
0.1604 times |
Fri 29 August 2025 |
233.27 (1.85%) |
228.67 |
228.50 - 235.99 |
1.0537 times |
Fri 22 August 2025 |
229.03 (-1.36%) |
233.47 |
225.54 - 235.60 |
0.999 times |
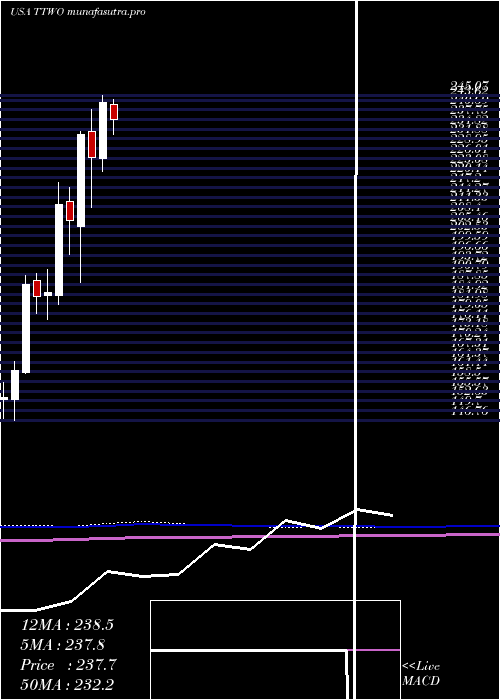
Monthly price and charts TakeTwo Strong monthly Stock price targets for TakeTwo TTWO are 255.62 and 269.46 | Monthly Target 1 | 244.83 | | Monthly Target 2 | 252.56 | | Monthly Target 3 | 258.67333333333 | | Monthly Target 4 | 266.4 | | Monthly Target 5 | 272.51 |
Monthly price and volumes Take Two
| Date |
Closing |
Open |
Range |
Volume |
Tue 21 October 2025 |
260.28 (0.74%) |
256.69 |
250.95 - 264.79 |
0.4704 times |
Tue 30 September 2025 |
258.36 (10.76%) |
231.16 |
229.33 - 261.47 |
0.965 times |
Fri 29 August 2025 |
233.27 (4.73%) |
222.82 |
216.34 - 239.13 |
0.9715 times |
Thu 31 July 2025 |
222.73 (-8.28%) |
242.43 |
222.30 - 243.90 |
0.9838 times |
Mon 30 June 2025 |
242.85 (7.32%) |
226.10 |
222.12 - 245.07 |
1.0594 times |
Fri 30 May 2025 |
226.28 (-3.02%) |
234.12 |
211.00 - 240.78 |
1.6826 times |
Wed 30 April 2025 |
233.32 (12.58%) |
205.23 |
188.56 - 234.09 |
1.0931 times |
Mon 31 March 2025 |
207.25 (-2.23%) |
212.89 |
197.00 - 217.18 |
0.851 times |
Fri 28 February 2025 |
211.98 (14.27%) |
184.62 |
181.86 - 218.75 |
1.0171 times |
Fri 31 January 2025 |
185.51 (0.78%) |
184.66 |
177.35 - 192.50 |
0.906 times |
Tue 31 December 2024 |
184.08 (-2.01%) |
188.97 |
179.00 - 191.26 |
0.5499 times |
DMA SMA EMA moving averages of Take Two TTWO
DMA (daily moving average) of Take Two TTWO
| DMA period | DMA value | | 5 day DMA | 260.93 | | 12 day DMA | 258.69 | | 20 day DMA | 256.91 | | 35 day DMA | 252.57 | | 50 day DMA | 246.5 | | 100 day DMA | 239.65 | | 150 day DMA | 232.41 | | 200 day DMA | 223.66 | EMA (exponential moving average) of Take Two TTWO
| EMA period | EMA current | EMA prev | EMA prev2 | | 5 day EMA | 260.38 | 260.43 | 259.5 | | 12 day EMA | 258.7 | 258.41 | 257.71 | | 20 day EMA | 256.48 | 256.08 | 255.43 | | 35 day EMA | 251.35 | 250.82 | 250.14 | | 50 day EMA | 246.19 | 245.62 | 244.94 |
SMA (simple moving average) of Take Two TTWO
| SMA period | SMA current | SMA prev | SMA prev2 | | 5 day SMA | 260.93 | 260.42 | 259.3 | | 12 day SMA | 258.69 | 258.47 | 258.05 | | 20 day SMA | 256.91 | 256.46 | 255.93 | | 35 day SMA | 252.57 | 252.02 | 251.19 | | 50 day SMA | 246.5 | 245.94 | 245.15 | | 100 day SMA | 239.65 | 239.33 | 238.97 | | 150 day SMA | 232.41 | 232.05 | 231.66 | | 200 day SMA | 223.66 | 223.3 | 222.91 |
|
|
