TtmTechnologies TTMI full analysis,charts,indicators,moving averages,SMA,DMA,EMA,ADX,MACD,RSITtm Technologies TTMI WideScreen charts, DMA,SMA,EMA technical analysis, forecast prediction, by indicators ADX,MACD,RSI,CCI USA stock exchange
operates under Technology sector & deals in Electrical Products
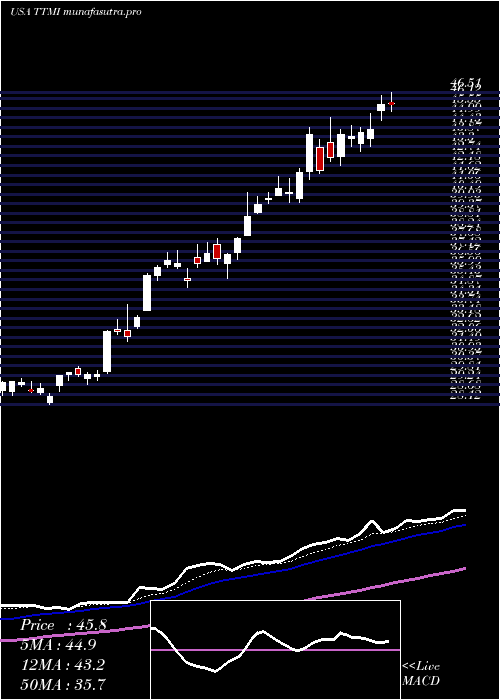
Daily price and charts and targets TtmTechnologies Strong Daily Stock price targets for TtmTechnologies TTMI are 73.25 and 75.49 | Daily Target 1 | 71.59 | | Daily Target 2 | 72.67 | | Daily Target 3 | 73.833333333333 | | Daily Target 4 | 74.91 | | Daily Target 5 | 76.07 |
Daily price and volume Ttm Technologies
| Date |
Closing |
Open |
Range |
Volume |
Fri 05 December 2025 |
73.74 (1.22%) |
72.80 |
72.76 - 75.00 |
1.5133 times |
Thu 04 December 2025 |
72.85 (9.12%) |
66.78 |
66.00 - 73.40 |
1.1009 times |
Wed 03 December 2025 |
66.76 (0.04%) |
66.67 |
64.21 - 68.79 |
1.1196 times |
Tue 02 December 2025 |
66.73 (-1.72%) |
68.33 |
66.66 - 69.93 |
0.3381 times |
Mon 01 December 2025 |
67.90 (-3.25%) |
68.80 |
65.65 - 68.97 |
0.8478 times |
Fri 28 November 2025 |
70.18 (2.77%) |
69.18 |
68.45 - 70.99 |
0.7222 times |
Wed 26 November 2025 |
68.29 (-0.35%) |
68.00 |
67.29 - 69.55 |
0.9928 times |
Tue 25 November 2025 |
68.53 (5.51%) |
64.98 |
63.40 - 68.91 |
0.7915 times |
Mon 24 November 2025 |
64.95 (10.48%) |
59.75 |
58.00 - 65.11 |
0.9012 times |
Fri 21 November 2025 |
58.79 (0.58%) |
58.68 |
55.44 - 59.73 |
1.6727 times |
Thu 20 November 2025 |
58.45 (-9.06%) |
67.96 |
57.41 - 68.36 |
1.4811 times |
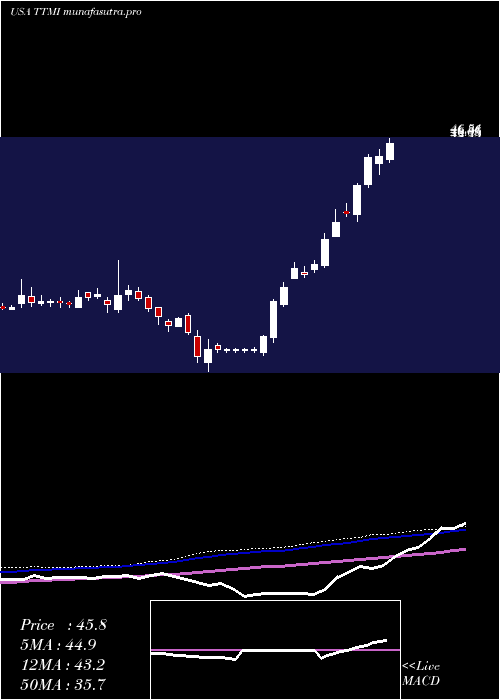
Weekly price and charts TtmTechnologies Strong weekly Stock price targets for TtmTechnologies TTMI are 68.98 and 79.77 | Weekly Target 1 | 60.19 | | Weekly Target 2 | 66.97 | | Weekly Target 3 | 70.983333333333 | | Weekly Target 4 | 77.76 | | Weekly Target 5 | 81.77 |
Weekly price and volumes for Ttm Technologies
| Date |
Closing |
Open |
Range |
Volume |
Fri 05 December 2025 |
73.74 (5.07%) |
68.80 |
64.21 - 75.00 |
0.8876 times |
Fri 28 November 2025 |
70.18 (19.37%) |
59.75 |
58.00 - 70.99 |
0.6148 times |
Fri 21 November 2025 |
58.79 (-13.53%) |
66.98 |
55.44 - 68.94 |
1.2973 times |
Fri 14 November 2025 |
67.99 (1.9%) |
69.95 |
60.35 - 71.85 |
1.1606 times |
Fri 07 November 2025 |
66.72 (-0.71%) |
66.95 |
63.10 - 71.17 |
0.8359 times |
Fri 31 October 2025 |
67.20 (0%) |
63.16 |
62.78 - 67.47 |
0.4799 times |
Fri 31 October 2025 |
67.20 (14.38%) |
60.14 |
57.00 - 67.47 |
1.89 times |
Fri 24 October 2025 |
58.75 (1.36%) |
58.37 |
54.43 - 60.33 |
0.7519 times |
Fri 17 October 2025 |
57.96 (8.17%) |
55.81 |
53.36 - 60.01 |
0.7922 times |
Fri 10 October 2025 |
53.58 (-10.48%) |
60.03 |
53.50 - 63.00 |
1.2896 times |
Fri 03 October 2025 |
59.85 (7.3%) |
56.49 |
56.09 - 62.60 |
1.5669 times |
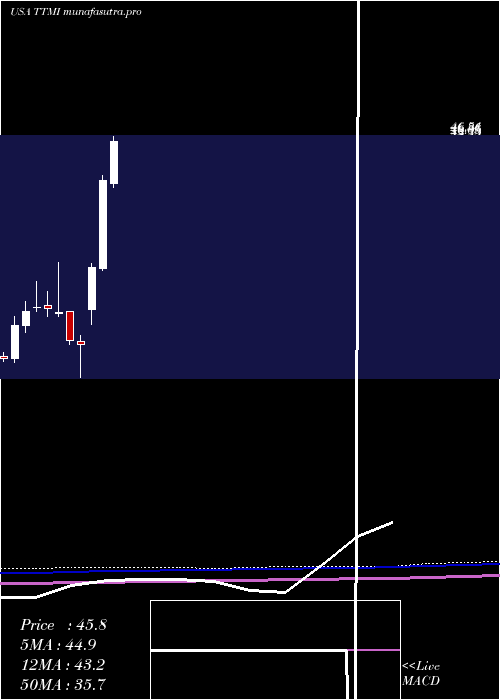
Monthly price and charts TtmTechnologies Strong monthly Stock price targets for TtmTechnologies TTMI are 68.98 and 79.77 | Monthly Target 1 | 60.19 | | Monthly Target 2 | 66.97 | | Monthly Target 3 | 70.983333333333 | | Monthly Target 4 | 77.76 | | Monthly Target 5 | 81.77 |
Monthly price and volumes Ttm Technologies
| Date |
Closing |
Open |
Range |
Volume |
Fri 05 December 2025 |
73.74 (5.07%) |
68.80 |
64.21 - 75.00 |
0.2454 times |
Fri 28 November 2025 |
70.18 (4.43%) |
66.95 |
55.44 - 71.85 |
1.0804 times |
Fri 31 October 2025 |
67.20 (16.67%) |
57.38 |
53.36 - 67.47 |
1.705 times |
Tue 30 September 2025 |
57.60 (29.23%) |
42.88 |
42.69 - 58.74 |
1.5363 times |
Fri 29 August 2025 |
44.57 (-5.67%) |
45.36 |
39.20 - 47.50 |
1.3567 times |
Thu 31 July 2025 |
47.25 (15.75%) |
40.55 |
40.01 - 51.15 |
1.7475 times |
Mon 30 June 2025 |
40.82 (36.7%) |
29.73 |
29.48 - 41.54 |
0.9788 times |
Fri 30 May 2025 |
29.86 (49.15%) |
24.42 |
22.58 - 30.35 |
0.5796 times |
Wed 30 April 2025 |
20.02 (-2.39%) |
20.37 |
15.77 - 21.17 |
0.3853 times |
Mon 31 March 2025 |
20.51 (-14.93%) |
24.21 |
20.04 - 24.26 |
0.385 times |
Fri 28 February 2025 |
24.11 (-1.95%) |
23.94 |
23.57 - 30.41 |
0.5275 times |
DMA SMA EMA moving averages of Ttm Technologies TTMI
DMA (daily moving average) of Ttm Technologies TTMI
| DMA period | DMA value | | 5 day DMA | 69.6 | | 12 day DMA | 66.79 | | 20 day DMA | 66.76 | | 35 day DMA | 64.66 | | 50 day DMA | 62.57 | | 100 day DMA | 54.53 | | 150 day DMA | 47.88 | | 200 day DMA | 41.19 | EMA (exponential moving average) of Ttm Technologies TTMI
| EMA period | EMA current | EMA prev | EMA prev2 | | 5 day EMA | 70.58 | 69 | 67.07 | | 12 day EMA | 68.3 | 67.31 | 66.3 | | 20 day EMA | 66.94 | 66.23 | 65.53 | | 35 day EMA | 64.62 | 64.08 | 63.56 | | 50 day EMA | 62.62 | 62.17 | 61.73 |
SMA (simple moving average) of Ttm Technologies TTMI
| SMA period | SMA current | SMA prev | SMA prev2 | | 5 day SMA | 69.6 | 68.88 | 67.97 | | 12 day SMA | 66.79 | 65.92 | 65.21 | | 20 day SMA | 66.76 | 66.48 | 66.34 | | 35 day SMA | 64.66 | 64.23 | 63.81 | | 50 day SMA | 62.57 | 62.18 | 61.81 | | 100 day SMA | 54.53 | 54.25 | 53.98 | | 150 day SMA | 47.88 | 47.55 | 47.19 | | 200 day SMA | 41.19 | 40.95 | 40.72 |
|
|
