TysonFoods TSN full analysis,charts,indicators,moving averages,SMA,DMA,EMA,ADX,MACD,RSITyson Foods TSN WideScreen charts, DMA,SMA,EMA technical analysis, forecast prediction, by indicators ADX,MACD,RSI,CCI USA stock exchange
operates under Consumer Non Durables sector & deals in Meat Poultry Fish
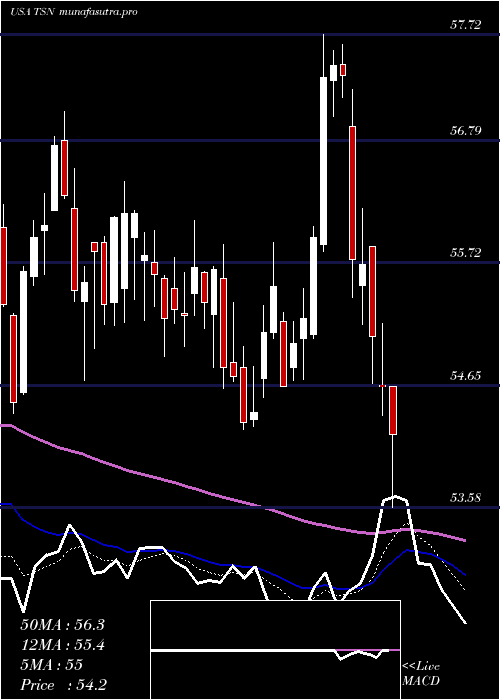
Daily price and charts and targets TysonFoods Strong Daily Stock price targets for TysonFoods TSN are 52.04 and 52.6 | Daily Target 1 | 51.89 | | Daily Target 2 | 52.19 | | Daily Target 3 | 52.453333333333 | | Daily Target 4 | 52.75 | | Daily Target 5 | 53.01 |
Daily price and volume Tyson Foods
| Date |
Closing |
Open |
Range |
Volume |
Mon 20 October 2025 |
52.48 (0%) |
52.54 |
52.16 - 52.72 |
0.8548 times |
Fri 17 October 2025 |
52.48 (0.61%) |
51.99 |
51.58 - 52.54 |
0.9135 times |
Thu 16 October 2025 |
52.16 (-1.23%) |
52.81 |
51.90 - 53.07 |
1.0964 times |
Wed 15 October 2025 |
52.81 (-0.08%) |
52.75 |
52.54 - 53.27 |
0.8529 times |
Tue 14 October 2025 |
52.85 (1.44%) |
51.58 |
51.07 - 52.93 |
1.2765 times |
Mon 13 October 2025 |
52.10 (-3.89%) |
51.71 |
51.50 - 52.21 |
1.3424 times |
Tue 07 October 2025 |
54.21 (0.11%) |
54.15 |
53.05 - 54.23 |
1.37 times |
Mon 06 October 2025 |
54.15 (-0.99%) |
54.69 |
54.09 - 54.69 |
0.9385 times |
Fri 03 October 2025 |
54.69 (0.28%) |
54.44 |
54.42 - 54.83 |
0.6627 times |
Thu 02 October 2025 |
54.54 (0.13%) |
54.42 |
54.05 - 54.74 |
0.6923 times |
Wed 01 October 2025 |
54.47 (0.31%) |
54.41 |
54.29 - 54.78 |
1.0204 times |
Weekly price and charts TysonFoods Strong weekly Stock price targets for TysonFoods TSN are 52.04 and 52.6 | Weekly Target 1 | 51.89 | | Weekly Target 2 | 52.19 | | Weekly Target 3 | 52.453333333333 | | Weekly Target 4 | 52.75 | | Weekly Target 5 | 53.01 |
Weekly price and volumes for Tyson Foods
| Date |
Closing |
Open |
Range |
Volume |
Mon 20 October 2025 |
52.48 (0%) |
52.54 |
52.16 - 52.72 |
0.2084 times |
Fri 17 October 2025 |
52.48 (-3.19%) |
51.71 |
51.07 - 53.27 |
1.3363 times |
Tue 07 October 2025 |
54.21 (-0.88%) |
54.69 |
53.05 - 54.69 |
0.5627 times |
Fri 03 October 2025 |
54.69 (0.92%) |
53.90 |
52.96 - 54.83 |
1.4086 times |
Fri 26 September 2025 |
54.19 (1.12%) |
53.57 |
53.29 - 54.75 |
1.2228 times |
Fri 19 September 2025 |
53.59 (-2.79%) |
55.28 |
53.59 - 55.38 |
1.3631 times |
Fri 12 September 2025 |
55.13 (-1.9%) |
55.77 |
54.82 - 56.43 |
1.2551 times |
Fri 05 September 2025 |
56.20 (-1.02%) |
56.72 |
55.41 - 56.90 |
0.9898 times |
Fri 29 August 2025 |
56.78 (0%) |
55.86 |
55.73 - 56.87 |
0.2585 times |
Fri 29 August 2025 |
56.78 (-1.44%) |
57.40 |
55.51 - 57.55 |
1.3947 times |
Fri 22 August 2025 |
57.61 (1.43%) |
56.81 |
55.85 - 57.75 |
1.1129 times |
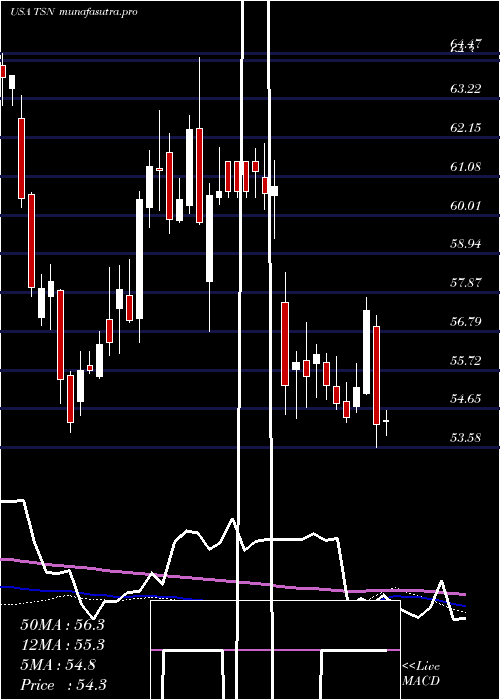
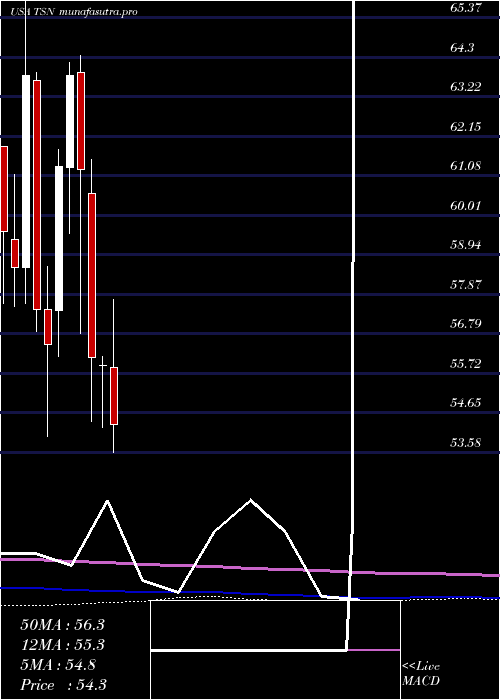
Monthly price and charts TysonFoods Strong monthly Stock price targets for TysonFoods TSN are 49.9 and 53.66 | Monthly Target 1 | 49.03 | | Monthly Target 2 | 50.76 | | Monthly Target 3 | 52.793333333333 | | Monthly Target 4 | 54.52 | | Monthly Target 5 | 56.55 |
Monthly price and volumes Tyson Foods
| Date |
Closing |
Open |
Range |
Volume |
Mon 20 October 2025 |
52.48 (-3.35%) |
54.41 |
51.07 - 54.83 |
0.5172 times |
Tue 30 September 2025 |
54.30 (-4.37%) |
56.72 |
52.96 - 56.90 |
1.0898 times |
Fri 29 August 2025 |
56.78 (8.57%) |
52.68 |
51.85 - 57.75 |
1.0782 times |
Thu 31 July 2025 |
52.30 (-6.51%) |
55.88 |
52.23 - 57.72 |
1.0369 times |
Mon 30 June 2025 |
55.94 (-0.39%) |
55.94 |
54.26 - 56.18 |
0.9191 times |
Fri 30 May 2025 |
56.16 (-8.3%) |
60.59 |
54.40 - 61.53 |
1.5743 times |
Wed 30 April 2025 |
61.24 (-4.03%) |
63.87 |
56.79 - 64.36 |
0.859 times |
Mon 31 March 2025 |
63.81 (4.03%) |
61.31 |
59.50 - 64.15 |
0.9285 times |
Fri 28 February 2025 |
61.34 (8.59%) |
57.42 |
56.17 - 61.80 |
0.9748 times |
Fri 31 January 2025 |
56.49 (-1.65%) |
57.45 |
54.01 - 58.63 |
1.0223 times |
Tue 31 December 2024 |
57.44 (-9.98%) |
63.67 |
56.85 - 63.87 |
0.65 times |
DMA SMA EMA moving averages of Tyson Foods TSN
DMA (daily moving average) of Tyson Foods TSN
| DMA period | DMA value | | 5 day DMA | 52.56 | | 12 day DMA | 53.44 | | 20 day DMA | 53.64 | | 35 day DMA | 54.53 | | 50 day DMA | 55.24 | | 100 day DMA | 55.08 | | 150 day DMA | 56.56 | | 200 day DMA | 56.91 | EMA (exponential moving average) of Tyson Foods TSN
| EMA period | EMA current | EMA prev | EMA prev2 | | 5 day EMA | 52.63 | 52.71 | 52.83 | | 12 day EMA | 53.16 | 53.28 | 53.43 | | 20 day EMA | 53.61 | 53.73 | 53.86 | | 35 day EMA | 54.25 | 54.35 | 54.46 | | 50 day EMA | 54.83 | 54.93 | 55.03 |
SMA (simple moving average) of Tyson Foods TSN
| SMA period | SMA current | SMA prev | SMA prev2 | | 5 day SMA | 52.56 | 52.48 | 52.83 | | 12 day SMA | 53.44 | 53.56 | 53.7 | | 20 day SMA | 53.64 | 53.72 | 53.81 | | 35 day SMA | 54.53 | 54.67 | 54.81 | | 50 day SMA | 55.24 | 55.31 | 55.35 | | 100 day SMA | 55.08 | 55.11 | 55.16 | | 150 day SMA | 56.56 | 56.61 | 56.67 | | 200 day SMA | 56.91 | 56.94 | 56.96 |
|
|
