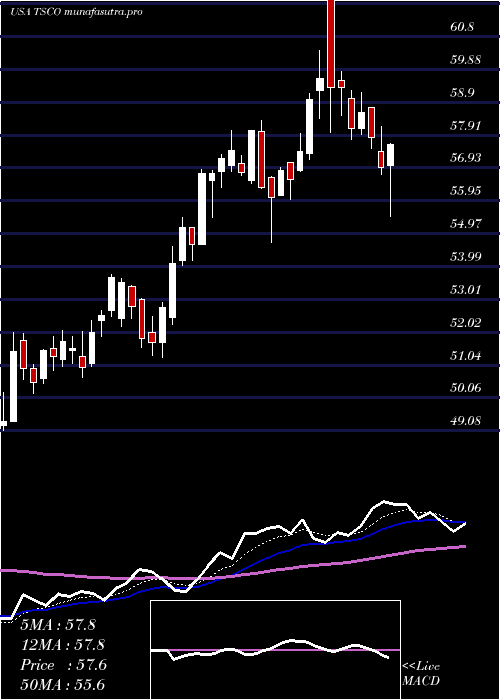
TractorSupply TSCO full analysis,charts,indicators,moving averages,SMA,DMA,EMA,ADX,MACD,RSITractor Supply TSCO WideScreen charts, DMA,SMA,EMA technical analysis, forecast prediction, by indicators ADX,MACD,RSI,CCI USA stock exchange
operates under Consumer Services sector & deals in RETAIL Building Materials
Daily price and charts and targets TractorSupply Strong Daily Stock price targets for TractorSupply TSCO are 54.7 and 55.41 | Daily Target 1 | 54.53 | | Daily Target 2 | 54.86 | | Daily Target 3 | 55.236666666667 | | Daily Target 4 | 55.57 | | Daily Target 5 | 55.95 |
Daily price and volume Tractor Supply
| Date |
Closing |
Open |
Range |
Volume |
Fri 17 October 2025 |
55.20 (0.07%) |
55.39 |
54.90 - 55.61 |
0.6957 times |
Thu 16 October 2025 |
55.16 (-1.16%) |
56.00 |
54.88 - 56.13 |
0.8121 times |
Wed 15 October 2025 |
55.81 (0.59%) |
55.54 |
55.50 - 56.58 |
1.3632 times |
Tue 14 October 2025 |
55.48 (1.04%) |
54.64 |
54.45 - 55.72 |
0.774 times |
Mon 13 October 2025 |
54.91 (1.24%) |
54.37 |
54.30 - 55.27 |
1.0633 times |
Fri 10 October 2025 |
54.24 (0.04%) |
54.46 |
53.50 - 54.73 |
1.2341 times |
Thu 09 October 2025 |
54.22 (0.56%) |
55.34 |
53.71 - 56.15 |
1.3114 times |
Wed 08 October 2025 |
53.92 (0.39%) |
53.69 |
53.27 - 54.35 |
0.9546 times |
Tue 07 October 2025 |
53.71 (-1.79%) |
54.58 |
53.26 - 54.78 |
1.0105 times |
Mon 06 October 2025 |
54.69 (-1.64%) |
55.81 |
54.66 - 56.06 |
0.7811 times |
Fri 03 October 2025 |
55.60 (-1.12%) |
56.49 |
55.43 - 56.49 |
0.4378 times |
Weekly price and charts TractorSupply Strong weekly Stock price targets for TractorSupply TSCO are 54.75 and 57.03 | Weekly Target 1 | 53.08 | | Weekly Target 2 | 54.14 | | Weekly Target 3 | 55.36 | | Weekly Target 4 | 56.42 | | Weekly Target 5 | 57.64 |
Weekly price and volumes for Tractor Supply
| Date |
Closing |
Open |
Range |
Volume |
Fri 17 October 2025 |
55.20 (1.77%) |
54.37 |
54.30 - 56.58 |
1.17 times |
Fri 10 October 2025 |
54.24 (-2.45%) |
55.81 |
53.26 - 56.15 |
1.315 times |
Fri 03 October 2025 |
55.60 (-1.63%) |
56.66 |
55.43 - 57.49 |
0.9895 times |
Fri 26 September 2025 |
56.52 (-5.26%) |
59.49 |
56.18 - 59.64 |
0.9916 times |
Fri 19 September 2025 |
59.66 (-1.57%) |
60.53 |
58.48 - 60.85 |
1.3274 times |
Fri 12 September 2025 |
60.61 (0.15%) |
60.36 |
58.25 - 60.65 |
1.0476 times |
Fri 05 September 2025 |
60.52 (-2.01%) |
61.71 |
59.99 - 62.26 |
0.8795 times |
Fri 29 August 2025 |
61.76 (0%) |
62.65 |
61.63 - 62.87 |
0.2664 times |
Fri 29 August 2025 |
61.76 (0.24%) |
61.46 |
61.01 - 62.89 |
1.0237 times |
Fri 22 August 2025 |
61.61 (1.85%) |
60.65 |
60.50 - 62.65 |
0.9895 times |
Fri 15 August 2025 |
60.49 (2.08%) |
59.37 |
58.52 - 60.55 |
1.1588 times |

Monthly price and charts TractorSupply Strong monthly Stock price targets for TractorSupply TSCO are 52.12 and 56.35 | Monthly Target 1 | 51.09 | | Monthly Target 2 | 53.14 | | Monthly Target 3 | 55.316666666667 | | Monthly Target 4 | 57.37 | | Monthly Target 5 | 59.55 |
Monthly price and volumes Tractor Supply
| Date |
Closing |
Open |
Range |
Volume |
Fri 17 October 2025 |
55.20 (-2.94%) |
56.92 |
53.26 - 57.49 |
0.5714 times |
Tue 30 September 2025 |
56.87 (-7.92%) |
61.71 |
55.98 - 62.26 |
0.8834 times |
Fri 29 August 2025 |
61.76 (8.45%) |
57.01 |
55.49 - 62.89 |
0.8301 times |
Thu 31 July 2025 |
56.95 (7.92%) |
52.46 |
52.25 - 63.99 |
1.3153 times |
Mon 30 June 2025 |
52.77 (9.03%) |
48.04 |
47.24 - 53.74 |
1.1467 times |
Fri 30 May 2025 |
48.40 (-4.39%) |
49.94 |
48.25 - 53.21 |
1.0983 times |
Wed 30 April 2025 |
50.62 (-8.13%) |
54.89 |
46.85 - 56.19 |
1.1598 times |
Mon 31 March 2025 |
55.10 (-0.45%) |
55.40 |
51.11 - 59.73 |
0.8903 times |
Fri 28 February 2025 |
55.35 (1.82%) |
53.50 |
52.50 - 58.06 |
0.9452 times |
Fri 31 January 2025 |
54.36 (2.45%) |
53.12 |
51.28 - 58.96 |
1.1595 times |
Tue 31 December 2024 |
53.06 (-81.06%) |
282.46 |
52.45 - 288.89 |
0.3986 times |

DMA SMA EMA moving averages of Tractor Supply TSCO
DMA (daily moving average) of Tractor Supply TSCO
| DMA period | DMA value | | 5 day DMA | 55.31 | | 12 day DMA | 54.93 | | 20 day DMA | 55.78 | | 35 day DMA | 57.59 | | 50 day DMA | 58.63 | | 100 day DMA | 56.61 | | 150 day DMA | 54.86 | | 200 day DMA | 54.92 | EMA (exponential moving average) of Tractor Supply TSCO
| EMA period | EMA current | EMA prev | EMA prev2 | | 5 day EMA | 55.19 | 55.19 | 55.2 | | 12 day EMA | 55.37 | 55.4 | 55.44 | | 20 day EMA | 55.97 | 56.05 | 56.14 | | 35 day EMA | 57.04 | 57.15 | 57.27 | | 50 day EMA | 58.36 | 58.49 | 58.63 |
SMA (simple moving average) of Tractor Supply TSCO
| SMA period | SMA current | SMA prev | SMA prev2 | | 5 day SMA | 55.31 | 55.12 | 54.93 | | 12 day SMA | 54.93 | 54.99 | 55.13 | | 20 day SMA | 55.78 | 56.01 | 56.24 | | 35 day SMA | 57.59 | 57.78 | 57.99 | | 50 day SMA | 58.63 | 58.71 | 58.81 | | 100 day SMA | 56.61 | 56.56 | 56.5 | | 150 day SMA | 54.86 | 54.84 | 54.82 | | 200 day SMA | 54.92 | 54.91 | 54.9 |
|
|
