TrupanionInc TRUP full analysis,charts,indicators,moving averages,SMA,DMA,EMA,ADX,MACD,RSITrupanion Inc TRUP WideScreen charts, DMA,SMA,EMA technical analysis, forecast prediction, by indicators ADX,MACD,RSI,CCI USA stock exchange
operates under Health Care sector & deals in Medical Specialities
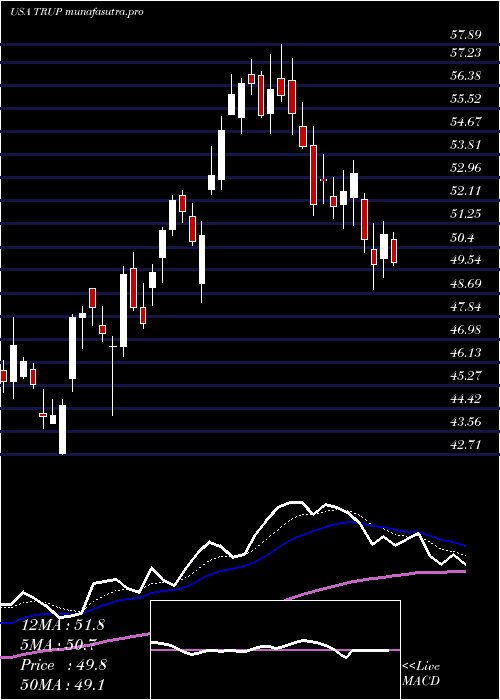
Daily price and charts and targets TrupanionInc Strong Daily Stock price targets for TrupanionInc TRUP are 36.51 and 38.34 | Daily Target 1 | 35.12 | | Daily Target 2 | 36.07 | | Daily Target 3 | 36.946666666667 | | Daily Target 4 | 37.9 | | Daily Target 5 | 38.78 |
Daily price and volume Trupanion Inc
| Date |
Closing |
Open |
Range |
Volume |
Thu 04 December 2025 |
37.03 (2.18%) |
36.35 |
35.99 - 37.82 |
1.005 times |
Wed 03 December 2025 |
36.24 (4.02%) |
35.17 |
35.10 - 36.95 |
1.0933 times |
Tue 02 December 2025 |
34.84 (2.38%) |
34.25 |
33.68 - 35.04 |
0.943 times |
Mon 01 December 2025 |
34.03 (-3.57%) |
34.86 |
33.85 - 35.06 |
0.9094 times |
Fri 28 November 2025 |
35.29 (0.6%) |
35.18 |
34.63 - 35.37 |
0.498 times |
Wed 26 November 2025 |
35.08 (-0.79%) |
35.42 |
35.03 - 35.79 |
1.0983 times |
Tue 25 November 2025 |
35.36 (-0.11%) |
35.31 |
34.74 - 35.90 |
0.9891 times |
Mon 24 November 2025 |
35.40 (-1.39%) |
35.86 |
34.95 - 36.62 |
0.9221 times |
Fri 21 November 2025 |
35.90 (2.37%) |
35.12 |
34.61 - 36.33 |
1.5993 times |
Thu 20 November 2025 |
35.07 (-2.77%) |
36.62 |
35.01 - 37.14 |
0.9424 times |
Wed 19 November 2025 |
36.07 (-2.01%) |
36.97 |
35.90 - 37.04 |
0.557 times |
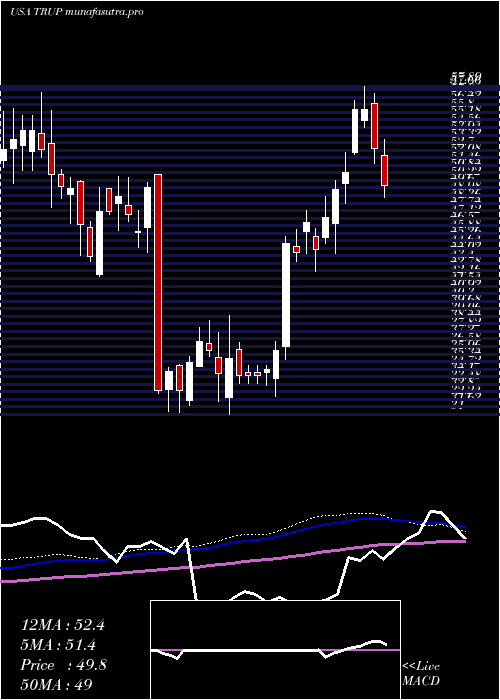
Weekly price and charts TrupanionInc Strong weekly Stock price targets for TrupanionInc TRUP are 35.36 and 39.5 | Weekly Target 1 | 32.04 | | Weekly Target 2 | 34.53 | | Weekly Target 3 | 36.176666666667 | | Weekly Target 4 | 38.67 | | Weekly Target 5 | 40.32 |
Weekly price and volumes for Trupanion Inc
| Date |
Closing |
Open |
Range |
Volume |
Thu 04 December 2025 |
37.03 (4.93%) |
34.86 |
33.68 - 37.82 |
0.9673 times |
Fri 28 November 2025 |
35.29 (-1.7%) |
35.86 |
34.63 - 36.62 |
0.8587 times |
Fri 21 November 2025 |
35.90 (-4.88%) |
37.73 |
34.61 - 37.90 |
1.1709 times |
Fri 14 November 2025 |
37.74 (-2.18%) |
38.31 |
36.74 - 40.69 |
1.2179 times |
Fri 07 November 2025 |
38.58 (-3.53%) |
39.47 |
38.13 - 46.98 |
1.4781 times |
Fri 31 October 2025 |
39.99 (0%) |
40.42 |
39.33 - 40.42 |
0.2398 times |
Fri 31 October 2025 |
39.99 (-8.7%) |
43.80 |
39.33 - 44.12 |
1.0773 times |
Fri 24 October 2025 |
43.80 (2.1%) |
43.24 |
42.93 - 44.78 |
0.8728 times |
Fri 17 October 2025 |
42.90 (3.82%) |
41.59 |
40.18 - 43.36 |
1.0907 times |
Fri 10 October 2025 |
41.32 (-4.97%) |
43.48 |
41.25 - 43.50 |
1.0265 times |
Fri 03 October 2025 |
43.48 (-0.44%) |
43.74 |
42.49 - 44.32 |
0.7832 times |
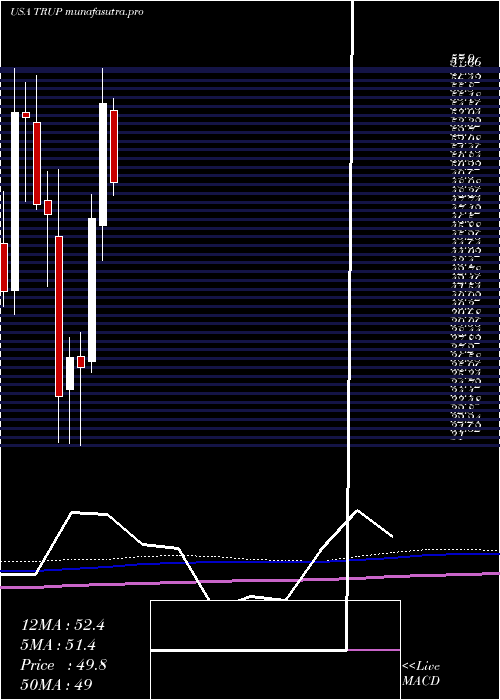
Monthly price and charts TrupanionInc Strong monthly Stock price targets for TrupanionInc TRUP are 35.36 and 39.5 | Monthly Target 1 | 32.04 | | Monthly Target 2 | 34.53 | | Monthly Target 3 | 36.176666666667 | | Monthly Target 4 | 38.67 | | Monthly Target 5 | 40.32 |
Monthly price and volumes Trupanion Inc
| Date |
Closing |
Open |
Range |
Volume |
Thu 04 December 2025 |
37.03 (4.93%) |
34.86 |
33.68 - 37.82 |
0.1854 times |
Fri 28 November 2025 |
35.29 (-11.75%) |
39.47 |
34.61 - 46.98 |
0.9058 times |
Fri 31 October 2025 |
39.99 (-7.6%) |
43.09 |
39.33 - 44.78 |
0.912 times |
Tue 30 September 2025 |
43.28 (-6.64%) |
45.67 |
41.21 - 46.43 |
0.9016 times |
Fri 29 August 2025 |
46.36 (-2.21%) |
46.94 |
45.16 - 57.00 |
1.2278 times |
Thu 31 July 2025 |
47.41 (-14.35%) |
54.85 |
46.93 - 55.74 |
1.1053 times |
Mon 30 June 2025 |
55.35 (17.29%) |
46.71 |
44.18 - 57.89 |
1.0511 times |
Fri 30 May 2025 |
47.19 (28.93%) |
37.03 |
36.21 - 48.87 |
1.2515 times |
Wed 30 April 2025 |
36.60 (-1.8%) |
37.34 |
31.00 - 39.09 |
1.2387 times |
Mon 31 March 2025 |
37.27 (7.9%) |
35.00 |
31.17 - 38.71 |
1.2208 times |
Fri 28 February 2025 |
34.54 (-27.19%) |
45.93 |
31.25 - 50.66 |
1.5045 times |
DMA SMA EMA moving averages of Trupanion Inc TRUP
DMA (daily moving average) of Trupanion Inc TRUP
| DMA period | DMA value | | 5 day DMA | 35.49 | | 12 day DMA | 35.59 | | 20 day DMA | 36.93 | | 35 day DMA | 39.24 | | 50 day DMA | 40.27 | | 100 day DMA | 43.63 | | 150 day DMA | 45.5 | | 200 day DMA | 43.02 | EMA (exponential moving average) of Trupanion Inc TRUP
| EMA period | EMA current | EMA prev | EMA prev2 | | 5 day EMA | 35.92 | 35.37 | 34.93 | | 12 day EMA | 36.12 | 35.96 | 35.91 | | 20 day EMA | 36.98 | 36.98 | 37.06 | | 35 day EMA | 38.45 | 38.53 | 38.66 | | 50 day EMA | 40.12 | 40.25 | 40.41 |
SMA (simple moving average) of Trupanion Inc TRUP
| SMA period | SMA current | SMA prev | SMA prev2 | | 5 day SMA | 35.49 | 35.1 | 34.92 | | 12 day SMA | 35.59 | 35.54 | 35.66 | | 20 day SMA | 36.93 | 37.2 | 37.36 | | 35 day SMA | 39.24 | 39.4 | 39.56 | | 50 day SMA | 40.27 | 40.38 | 40.53 | | 100 day SMA | 43.63 | 43.76 | 43.9 | | 150 day SMA | 45.5 | 45.5 | 45.51 | | 200 day SMA | 43.02 | 43.08 | 43.14 |
|
|
