TrinityBiotech TRIB full analysis,charts,indicators,moving averages,SMA,DMA,EMA,ADX,MACD,RSITrinity Biotech TRIB WideScreen charts, DMA,SMA,EMA technical analysis, forecast prediction, by indicators ADX,MACD,RSI,CCI USA stock exchange
operates under Health Care sector & deals in Biotechnology In Vitro In Vivo Diagnostic Substances
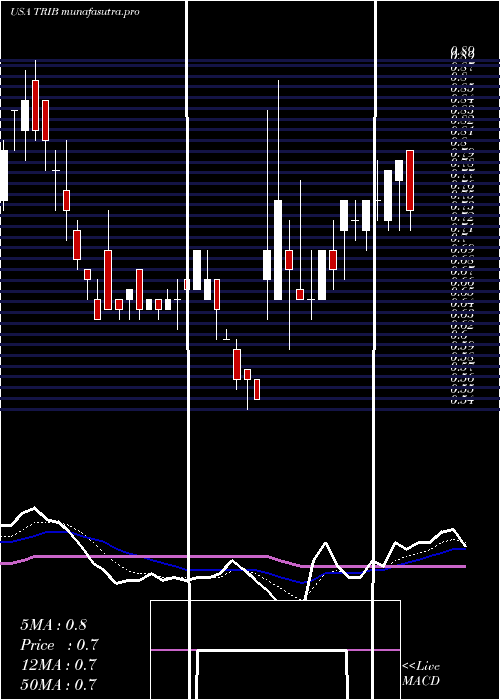
Daily price and charts and targets TrinityBiotech Strong Daily Stock price targets for TrinityBiotech TRIB are 0.98 and 1.06 | Daily Target 1 | 0.91 | | Daily Target 2 | 0.96 | | Daily Target 3 | 0.99333333333333 | | Daily Target 4 | 1.04 | | Daily Target 5 | 1.07 |
Daily price and volume Trinity Biotech
| Date |
Closing |
Open |
Range |
Volume |
Thu 04 December 2025 |
1.00 (0%) |
0.95 |
0.95 - 1.03 |
0.6694 times |
Wed 03 December 2025 |
1.00 (-0.99%) |
1.04 |
0.98 - 1.04 |
0.4132 times |
Tue 02 December 2025 |
1.01 (-0.98%) |
1.05 |
1.00 - 1.05 |
0.8583 times |
Mon 01 December 2025 |
1.02 (-2.86%) |
1.03 |
0.96 - 1.05 |
0.7199 times |
Fri 28 November 2025 |
1.05 (7.14%) |
0.97 |
0.94 - 1.05 |
0.6395 times |
Wed 26 November 2025 |
0.98 (10.11%) |
0.91 |
0.89 - 1.05 |
1.9895 times |
Tue 25 November 2025 |
0.89 (0%) |
0.92 |
0.87 - 0.93 |
1.2827 times |
Mon 24 November 2025 |
0.89 (7.23%) |
0.85 |
0.85 - 0.93 |
1.81 times |
Fri 21 November 2025 |
0.83 (0%) |
0.89 |
0.82 - 0.89 |
0.8508 times |
Thu 20 November 2025 |
0.83 (-1.19%) |
0.83 |
0.80 - 0.85 |
0.7666 times |
Wed 19 November 2025 |
0.84 (2.44%) |
0.81 |
0.80 - 0.94 |
1.7745 times |
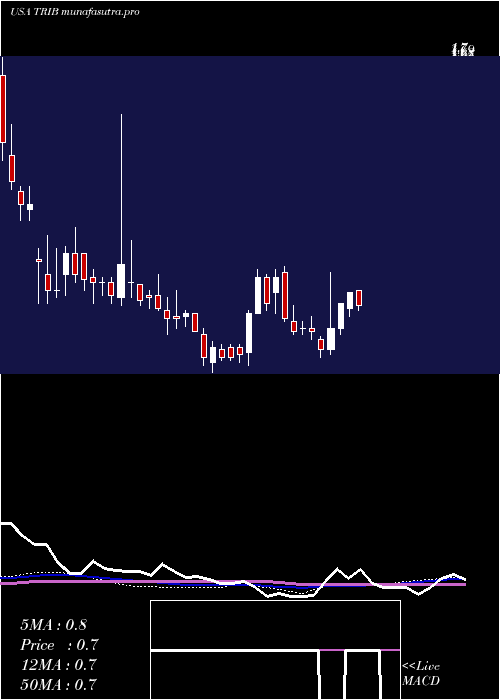
Weekly price and charts TrinityBiotech Strong weekly Stock price targets for TrinityBiotech TRIB are 0.93 and 1.03 | Weekly Target 1 | 0.9 | | Weekly Target 2 | 0.95 | | Weekly Target 3 | 1 | | Weekly Target 4 | 1.05 | | Weekly Target 5 | 1.1 |
Weekly price and volumes for Trinity Biotech
| Date |
Closing |
Open |
Range |
Volume |
Thu 04 December 2025 |
1.00 (-4.76%) |
1.03 |
0.95 - 1.05 |
0.3788 times |
Fri 28 November 2025 |
1.05 (26.51%) |
0.85 |
0.85 - 1.05 |
0.8147 times |
Fri 21 November 2025 |
0.83 (-5.68%) |
0.88 |
0.80 - 0.94 |
0.6858 times |
Fri 14 November 2025 |
0.88 (-7.37%) |
0.95 |
0.84 - 0.97 |
0.7042 times |
Fri 07 November 2025 |
0.95 (-5%) |
0.99 |
0.90 - 1.04 |
0.8961 times |
Fri 31 October 2025 |
1.00 (0%) |
1.00 |
0.94 - 1.02 |
0.1057 times |
Fri 31 October 2025 |
1.00 (0%) |
1.00 |
0.94 - 1.10 |
0.956 times |
Fri 24 October 2025 |
1.00 (0%) |
1.01 |
0.87 - 1.03 |
1.2399 times |
Fri 17 October 2025 |
1.00 (-4.76%) |
1.03 |
0.96 - 1.10 |
1.2159 times |
Fri 10 October 2025 |
1.05 (-2.78%) |
1.15 |
1.03 - 1.17 |
3.0028 times |
Fri 03 October 2025 |
1.08 (0.93%) |
1.07 |
1.00 - 1.17 |
1.194 times |
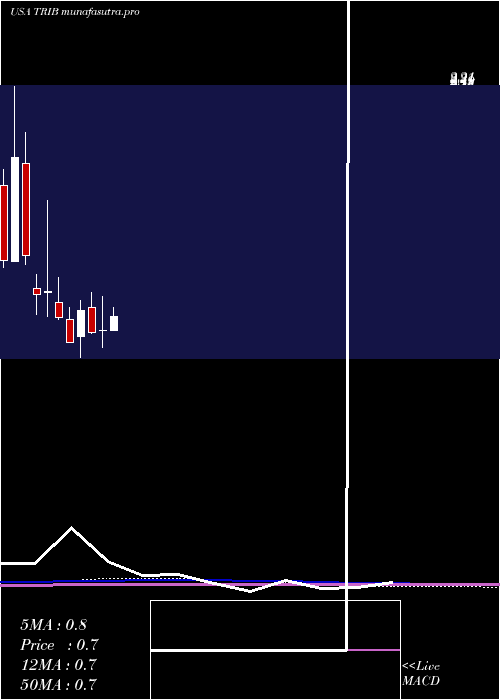
Monthly price and charts TrinityBiotech Strong monthly Stock price targets for TrinityBiotech TRIB are 0.93 and 1.03 | Monthly Target 1 | 0.9 | | Monthly Target 2 | 0.95 | | Monthly Target 3 | 1 | | Monthly Target 4 | 1.05 | | Monthly Target 5 | 1.1 |
Monthly price and volumes Trinity Biotech
| Date |
Closing |
Open |
Range |
Volume |
Thu 04 December 2025 |
1.00 (-4.76%) |
1.03 |
0.95 - 1.05 |
0.0043 times |
Fri 28 November 2025 |
1.05 (5%) |
0.99 |
0.80 - 1.05 |
0.0349 times |
Fri 31 October 2025 |
1.00 (-3.85%) |
1.03 |
0.87 - 1.17 |
0.0792 times |
Tue 30 September 2025 |
1.04 (-28.77%) |
1.46 |
1.00 - 1.50 |
0.1068 times |
Fri 29 August 2025 |
1.46 (111.59%) |
0.70 |
0.70 - 3.44 |
8.1313 times |
Thu 31 July 2025 |
0.69 (6.15%) |
0.65 |
0.64 - 0.80 |
0.1178 times |
Mon 30 June 2025 |
0.65 (1.56%) |
0.65 |
0.54 - 0.87 |
1.4247 times |
Fri 30 May 2025 |
0.64 (-17.95%) |
0.80 |
0.63 - 0.89 |
0.0452 times |
Wed 30 April 2025 |
0.78 (36.84%) |
0.61 |
0.48 - 0.84 |
0.0316 times |
Mon 31 March 2025 |
0.57 (-21.92%) |
0.72 |
0.57 - 0.80 |
0.0243 times |
Fri 28 February 2025 |
0.73 (-18.89%) |
0.83 |
0.72 - 0.99 |
0.1085 times |
DMA SMA EMA moving averages of Trinity Biotech TRIB
DMA (daily moving average) of Trinity Biotech TRIB
| DMA period | DMA value | | 5 day DMA | 1.02 | | 12 day DMA | 0.93 | | 20 day DMA | 0.92 | | 35 day DMA | 0.95 | | 50 day DMA | 0.99 | | 100 day DMA | 1.06 | | 150 day DMA | 0.94 | | 200 day DMA | 0.87 | EMA (exponential moving average) of Trinity Biotech TRIB
| EMA period | EMA current | EMA prev | EMA prev2 | | 5 day EMA | 0.99 | 0.99 | 0.99 | | 12 day EMA | 0.96 | 0.95 | 0.94 | | 20 day EMA | 0.96 | 0.96 | 0.96 | | 35 day EMA | 0.94 | 0.94 | 0.94 | | 50 day EMA | 1 | 1 | 1 |
SMA (simple moving average) of Trinity Biotech TRIB
| SMA period | SMA current | SMA prev | SMA prev2 | | 5 day SMA | 1.02 | 1.01 | 0.99 | | 12 day SMA | 0.93 | 0.92 | 0.91 | | 20 day SMA | 0.92 | 0.92 | 0.92 | | 35 day SMA | 0.95 | 0.95 | 0.95 | | 50 day SMA | 0.99 | 0.99 | 0.99 | | 100 day SMA | 1.06 | 1.05 | 1.05 | | 150 day SMA | 0.94 | 0.94 | 0.94 | | 200 day SMA | 0.87 | 0.87 | 0.87 |
|
|
