TargaResources TRGP full analysis,charts,indicators,moving averages,SMA,DMA,EMA,ADX,MACD,RSITarga Resources TRGP WideScreen charts, DMA,SMA,EMA technical analysis, forecast prediction, by indicators ADX,MACD,RSI,CCI USA stock exchange
operates under Public Utilities sector & deals in Natural Gas Distribution
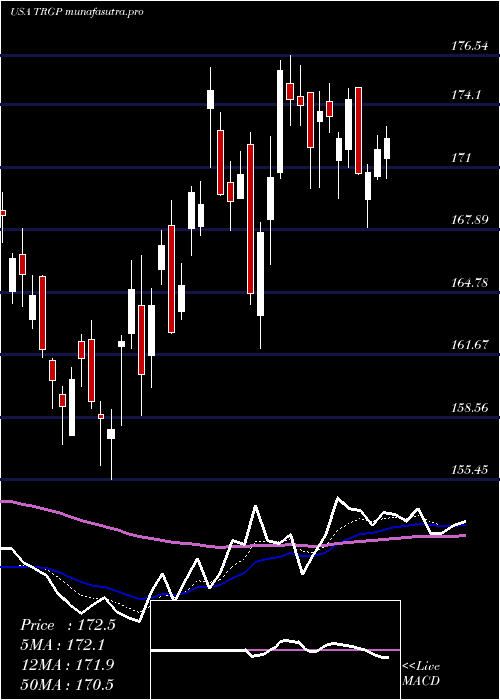
Daily price and charts and targets TargaResources Strong Daily Stock price targets for TargaResources TRGP are 149.98 and 152.52 | Daily Target 1 | 147.96 | | Daily Target 2 | 149.45 | | Daily Target 3 | 150.5 | | Daily Target 4 | 151.99 | | Daily Target 5 | 153.04 |
Daily price and volume Targa Resources
| Date |
Closing |
Open |
Range |
Volume |
Mon 20 October 2025 |
150.94 (1.53%) |
150.10 |
149.01 - 151.55 |
0.6696 times |
Fri 17 October 2025 |
148.67 (1.62%) |
145.95 |
144.14 - 148.69 |
1.1314 times |
Thu 16 October 2025 |
146.30 (-3.15%) |
151.87 |
145.86 - 152.76 |
1.1377 times |
Wed 15 October 2025 |
151.06 (0.45%) |
151.67 |
149.30 - 153.75 |
0.7945 times |
Tue 14 October 2025 |
150.38 (-0.92%) |
148.97 |
147.31 - 151.63 |
1.0748 times |
Mon 13 October 2025 |
151.77 (-0.42%) |
153.94 |
151.61 - 154.96 |
0.7148 times |
Fri 10 October 2025 |
152.41 (-5.51%) |
159.50 |
152.33 - 161.00 |
1.184 times |
Thu 09 October 2025 |
161.30 (-4.27%) |
168.35 |
160.02 - 169.53 |
0.8679 times |
Wed 08 October 2025 |
168.49 (1.23%) |
166.19 |
162.27 - 169.30 |
1.2724 times |
Tue 07 October 2025 |
166.44 (2.36%) |
163.47 |
162.73 - 166.65 |
1.1529 times |
Mon 06 October 2025 |
162.60 (0.18%) |
163.60 |
160.77 - 163.97 |
0.4966 times |
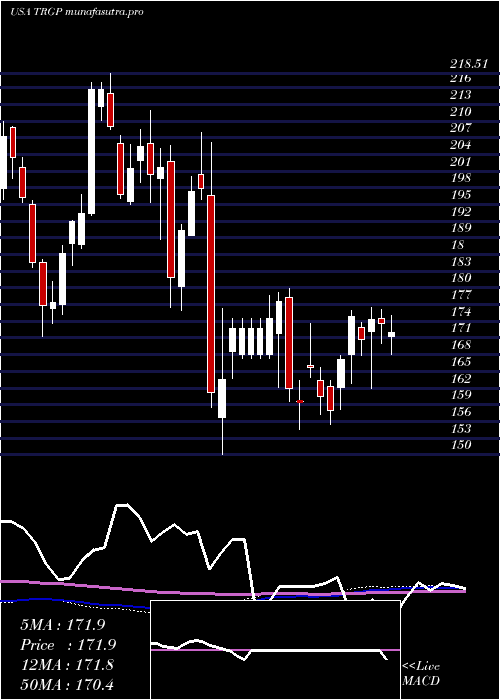
Weekly price and charts TargaResources Strong weekly Stock price targets for TargaResources TRGP are 149.98 and 152.52 | Weekly Target 1 | 147.96 | | Weekly Target 2 | 149.45 | | Weekly Target 3 | 150.5 | | Weekly Target 4 | 151.99 | | Weekly Target 5 | 153.04 |
Weekly price and volumes for Targa Resources
| Date |
Closing |
Open |
Range |
Volume |
Mon 20 October 2025 |
150.94 (1.53%) |
150.10 |
149.01 - 151.55 |
0.1811 times |
Fri 17 October 2025 |
148.67 (-2.45%) |
153.94 |
144.14 - 154.96 |
1.3127 times |
Fri 10 October 2025 |
152.41 (-6.09%) |
163.60 |
152.33 - 169.53 |
1.3453 times |
Fri 03 October 2025 |
162.30 (-6.83%) |
173.16 |
161.26 - 173.24 |
1.1705 times |
Fri 26 September 2025 |
174.19 (5.94%) |
162.96 |
161.54 - 175.78 |
1.1143 times |
Fri 19 September 2025 |
164.43 (-1.17%) |
166.95 |
162.30 - 171.21 |
1.7223 times |
Fri 12 September 2025 |
166.38 (2.48%) |
163.52 |
159.10 - 168.07 |
1.0618 times |
Fri 05 September 2025 |
162.35 (-3.22%) |
166.76 |
157.80 - 167.67 |
0.875 times |
Fri 29 August 2025 |
167.76 (0%) |
167.02 |
166.84 - 168.79 |
0.1689 times |
Fri 29 August 2025 |
167.76 (2.76%) |
162.41 |
160.58 - 168.79 |
1.0482 times |
Fri 22 August 2025 |
163.26 (0.04%) |
162.21 |
159.09 - 164.96 |
1.1964 times |
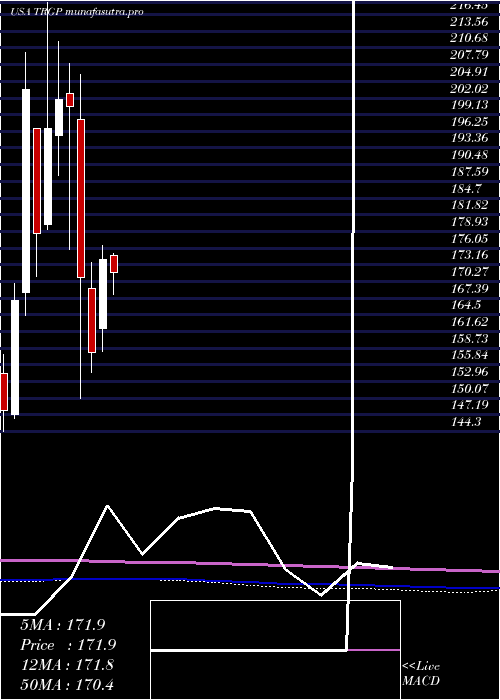
Monthly price and charts TargaResources Strong monthly Stock price targets for TargaResources TRGP are 133.9 and 161.18 | Monthly Target 1 | 128.22 | | Monthly Target 2 | 139.58 | | Monthly Target 3 | 155.5 | | Monthly Target 4 | 166.86 | | Monthly Target 5 | 182.78 |
Monthly price and volumes Targa Resources
| Date |
Closing |
Open |
Range |
Volume |
Mon 20 October 2025 |
150.94 (-9.91%) |
165.78 |
144.14 - 171.42 |
0.5892 times |
Tue 30 September 2025 |
167.54 (-0.13%) |
166.76 |
157.80 - 175.78 |
0.8814 times |
Fri 29 August 2025 |
167.76 (0.81%) |
163.67 |
159.09 - 170.62 |
0.9144 times |
Thu 31 July 2025 |
166.41 (-4.41%) |
174.71 |
161.34 - 175.17 |
0.8198 times |
Mon 30 June 2025 |
174.08 (10.23%) |
162.10 |
158.15 - 176.54 |
1.0725 times |
Fri 30 May 2025 |
157.93 (-7.59%) |
169.00 |
154.45 - 173.62 |
1.3368 times |
Wed 30 April 2025 |
170.90 (-14.75%) |
198.27 |
150.00 - 206.09 |
1.5623 times |
Mon 31 March 2025 |
200.47 (-0.62%) |
202.74 |
175.85 - 207.92 |
0.9678 times |
Fri 28 February 2025 |
201.72 (2.5%) |
195.50 |
188.65 - 211.87 |
0.8994 times |
Fri 31 January 2025 |
196.80 (10.25%) |
180.17 |
179.28 - 218.51 |
0.9564 times |
Tue 31 December 2024 |
178.50 (-12.25%) |
196.65 |
171.19 - 196.65 |
0.8672 times |
DMA SMA EMA moving averages of Targa Resources TRGP
DMA (daily moving average) of Targa Resources TRGP
| DMA period | DMA value | | 5 day DMA | 149.47 | | 12 day DMA | 156.06 | | 20 day DMA | 161.41 | | 35 day DMA | 162.77 | | 50 day DMA | 163.25 | | 100 day DMA | 165.41 | | 150 day DMA | 168.16 | | 200 day DMA | 175.86 | EMA (exponential moving average) of Targa Resources TRGP
| EMA period | EMA current | EMA prev | EMA prev2 | | 5 day EMA | 150.6 | 150.43 | 151.31 | | 12 day EMA | 154.83 | 155.54 | 156.79 | | 20 day EMA | 157.94 | 158.68 | 159.73 | | 35 day EMA | 160.58 | 161.15 | 161.88 | | 50 day EMA | 162.02 | 162.47 | 163.03 |
SMA (simple moving average) of Targa Resources TRGP
| SMA period | SMA current | SMA prev | SMA prev2 | | 5 day SMA | 149.47 | 149.64 | 150.38 | | 12 day SMA | 156.06 | 157.03 | 158.65 | | 20 day SMA | 161.41 | 162.13 | 162.92 | | 35 day SMA | 162.77 | 163.25 | 163.79 | | 50 day SMA | 163.25 | 163.55 | 163.88 | | 100 day SMA | 165.41 | 165.51 | 165.63 | | 150 day SMA | 168.16 | 168.47 | 168.74 | | 200 day SMA | 175.86 | 176.04 | 176.21 |
|
|
