LendingtreeInc TREE full analysis,charts,indicators,moving averages,SMA,DMA,EMA,ADX,MACD,RSILendingtree Inc TREE WideScreen charts, DMA,SMA,EMA technical analysis, forecast prediction, by indicators ADX,MACD,RSI,CCI USA stock exchange
operates under Finance sector & deals in Finance Consumer Services
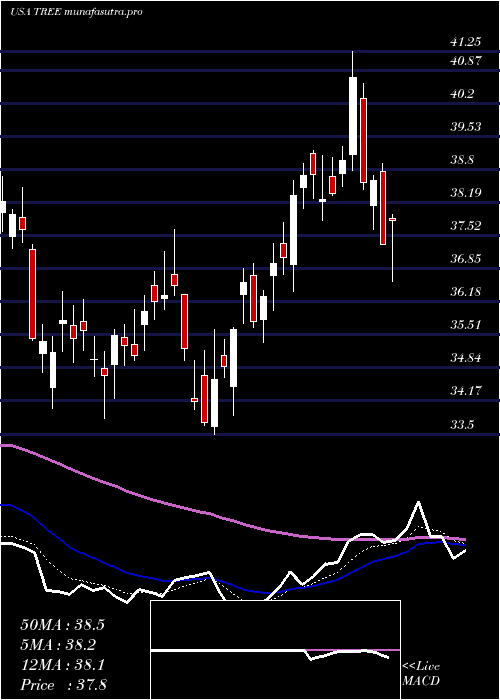
Daily price and charts and targets LendingtreeInc Strong Daily Stock price targets for LendingtreeInc TREE are 56.59 and 58.34 | Daily Target 1 | 55.22 | | Daily Target 2 | 56.2 | | Daily Target 3 | 56.966666666667 | | Daily Target 4 | 57.95 | | Daily Target 5 | 58.72 |
Daily price and volume Lendingtree Inc
| Date |
Closing |
Open |
Range |
Volume |
Thu 04 December 2025 |
57.19 (0.83%) |
56.79 |
55.98 - 57.73 |
0.5478 times |
Wed 03 December 2025 |
56.72 (1.79%) |
55.81 |
55.44 - 58.31 |
0.8784 times |
Tue 02 December 2025 |
55.72 (-1.38%) |
56.83 |
54.93 - 56.99 |
0.632 times |
Mon 01 December 2025 |
56.50 (-0.93%) |
56.50 |
55.51 - 56.73 |
0.818 times |
Fri 28 November 2025 |
57.03 (-0.35%) |
57.40 |
56.32 - 58.02 |
0.5192 times |
Wed 26 November 2025 |
57.23 (3.34%) |
65.50 |
55.00 - 65.50 |
0.8676 times |
Tue 25 November 2025 |
55.38 (8.55%) |
51.50 |
51.34 - 55.74 |
0.8016 times |
Mon 24 November 2025 |
51.02 (0.89%) |
50.57 |
49.89 - 52.95 |
1.7446 times |
Fri 21 November 2025 |
50.57 (5.11%) |
48.30 |
47.75 - 51.50 |
1.725 times |
Thu 20 November 2025 |
48.11 (-2.51%) |
49.86 |
47.99 - 51.72 |
1.4659 times |
Wed 19 November 2025 |
49.35 (0.96%) |
49.00 |
48.37 - 50.32 |
1.0119 times |
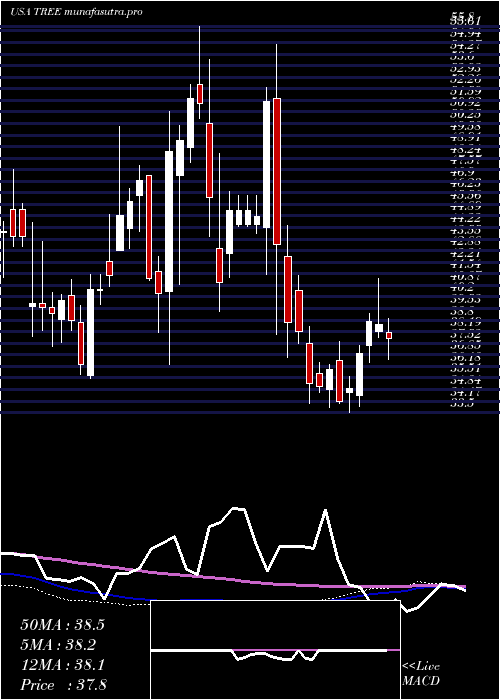
Weekly price and charts LendingtreeInc Strong weekly Stock price targets for LendingtreeInc TREE are 56.06 and 59.44 | Weekly Target 1 | 53.43 | | Weekly Target 2 | 55.31 | | Weekly Target 3 | 56.81 | | Weekly Target 4 | 58.69 | | Weekly Target 5 | 60.19 |
Weekly price and volumes for Lendingtree Inc
| Date |
Closing |
Open |
Range |
Volume |
Thu 04 December 2025 |
57.19 (0.28%) |
56.50 |
54.93 - 58.31 |
0.5023 times |
Fri 28 November 2025 |
57.03 (12.77%) |
50.57 |
49.89 - 65.50 |
0.6868 times |
Fri 21 November 2025 |
50.57 (2.95%) |
49.56 |
47.70 - 51.72 |
1.0621 times |
Fri 14 November 2025 |
49.12 (-5.61%) |
52.95 |
48.75 - 54.17 |
1.0395 times |
Fri 07 November 2025 |
52.04 (-18.69%) |
64.91 |
51.18 - 64.91 |
1.2627 times |
Fri 31 October 2025 |
64.00 (0%) |
64.87 |
62.93 - 66.09 |
0.5187 times |
Fri 31 October 2025 |
64.00 (1.81%) |
63.05 |
59.88 - 68.32 |
1.8986 times |
Fri 24 October 2025 |
62.86 (9.99%) |
57.89 |
57.51 - 63.63 |
0.8125 times |
Fri 17 October 2025 |
57.15 (0.42%) |
57.97 |
51.55 - 61.14 |
1.3481 times |
Fri 10 October 2025 |
56.91 (-9.94%) |
63.32 |
56.60 - 63.41 |
0.8687 times |
Fri 03 October 2025 |
63.19 (-10.45%) |
71.17 |
63.00 - 71.17 |
0.8535 times |
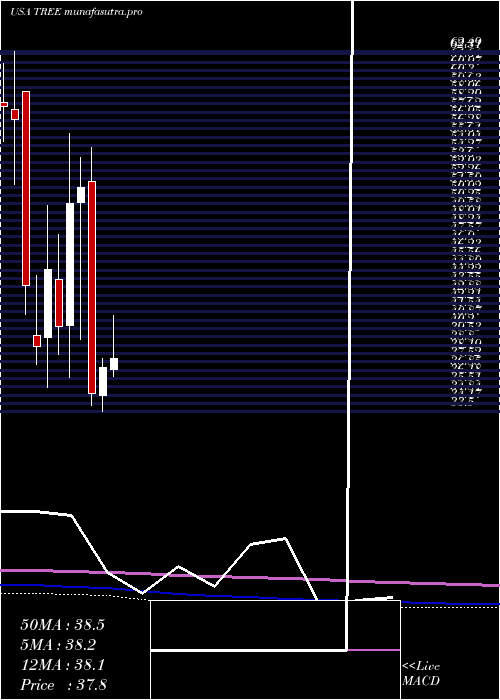
Monthly price and charts LendingtreeInc Strong monthly Stock price targets for LendingtreeInc TREE are 56.06 and 59.44 | Monthly Target 1 | 53.43 | | Monthly Target 2 | 55.31 | | Monthly Target 3 | 56.81 | | Monthly Target 4 | 58.69 | | Monthly Target 5 | 60.19 |
Monthly price and volumes Lendingtree Inc
| Date |
Closing |
Open |
Range |
Volume |
Thu 04 December 2025 |
57.19 (0.28%) |
56.50 |
54.93 - 58.31 |
0.0925 times |
Fri 28 November 2025 |
57.03 (-10.89%) |
64.91 |
47.70 - 65.50 |
0.7458 times |
Fri 31 October 2025 |
64.00 (-1.13%) |
65.42 |
51.55 - 68.32 |
1.0678 times |
Tue 30 September 2025 |
64.73 (-4.74%) |
65.89 |
63.88 - 77.35 |
0.7562 times |
Fri 29 August 2025 |
67.95 (45.57%) |
48.35 |
45.08 - 70.72 |
1.2315 times |
Thu 31 July 2025 |
46.68 (25.92%) |
36.94 |
36.38 - 51.00 |
1.2206 times |
Mon 30 June 2025 |
37.07 (5.85%) |
34.83 |
33.50 - 37.78 |
0.8302 times |
Fri 30 May 2025 |
35.02 (-32.12%) |
52.00 |
34.01 - 54.81 |
2.0159 times |
Wed 30 April 2025 |
51.59 (2.63%) |
50.31 |
39.33 - 53.97 |
0.9144 times |
Mon 31 March 2025 |
50.27 (24.46%) |
40.49 |
36.29 - 55.86 |
1.1251 times |
Fri 28 February 2025 |
40.39 (-10.1%) |
44.15 |
38.13 - 47.79 |
0.497 times |
DMA SMA EMA moving averages of Lendingtree Inc TREE
DMA (daily moving average) of Lendingtree Inc TREE
| DMA period | DMA value | | 5 day DMA | 56.63 | | 12 day DMA | 53.64 | | 20 day DMA | 52.73 | | 35 day DMA | 56.13 | | 50 day DMA | 57.93 | | 100 day DMA | 59.44 | | 150 day DMA | 52.09 | | 200 day DMA | 50.57 | EMA (exponential moving average) of Lendingtree Inc TREE
| EMA period | EMA current | EMA prev | EMA prev2 | | 5 day EMA | 56.32 | 55.89 | 55.47 | | 12 day EMA | 55 | 54.6 | 54.21 | | 20 day EMA | 55.04 | 54.81 | 54.61 | | 35 day EMA | 56.47 | 56.43 | 56.41 | | 50 day EMA | 59.01 | 59.08 | 59.18 |
SMA (simple moving average) of Lendingtree Inc TREE
| SMA period | SMA current | SMA prev | SMA prev2 | | 5 day SMA | 56.63 | 56.64 | 56.37 | | 12 day SMA | 53.64 | 52.91 | 52.28 | | 20 day SMA | 52.73 | 52.77 | 53.04 | | 35 day SMA | 56.13 | 56.21 | 56.25 | | 50 day SMA | 57.93 | 58.17 | 58.44 | | 100 day SMA | 59.44 | 59.24 | 59.06 | | 150 day SMA | 52.09 | 52.05 | 52.03 | | 200 day SMA | 50.57 | 50.51 | 50.46 |
|
|
