TejonRanch TRC full analysis,charts,indicators,moving averages,SMA,DMA,EMA,ADX,MACD,RSITejon Ranch TRC WideScreen charts, DMA,SMA,EMA technical analysis, forecast prediction, by indicators ADX,MACD,RSI,CCI USA stock exchange
operates under Finance sector & deals in Real Estate
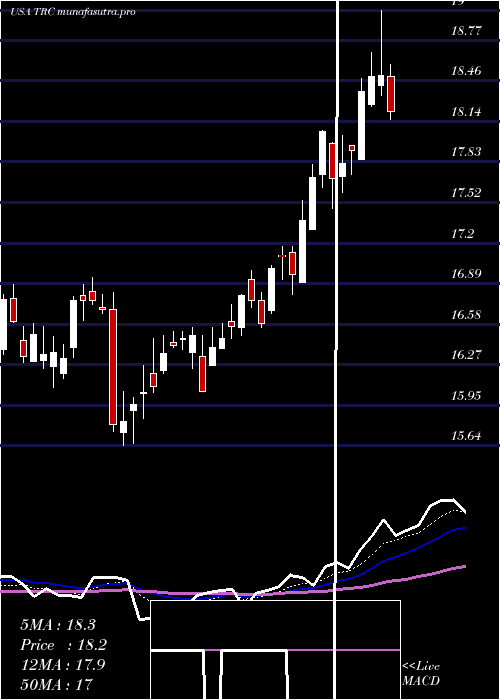
Daily price and charts and targets TejonRanch Strong Daily Stock price targets for TejonRanch TRC are 15.67 and 16 | Daily Target 1 | 15.41 | | Daily Target 2 | 15.6 | | Daily Target 3 | 15.74 | | Daily Target 4 | 15.93 | | Daily Target 5 | 16.07 |
Daily price and volume Tejon Ranch
| Date |
Closing |
Open |
Range |
Volume |
Mon 20 October 2025 |
15.79 (1.61%) |
15.63 |
15.55 - 15.88 |
0.8678 times |
Fri 17 October 2025 |
15.54 (-0.96%) |
15.64 |
15.53 - 15.77 |
0.8707 times |
Thu 16 October 2025 |
15.69 (-1.32%) |
15.88 |
15.60 - 15.96 |
1.1046 times |
Wed 15 October 2025 |
15.90 (0.89%) |
15.76 |
15.76 - 16.03 |
0.96 times |
Tue 14 October 2025 |
15.76 (0.96%) |
15.47 |
15.47 - 15.84 |
0.9794 times |
Mon 13 October 2025 |
15.61 (0.45%) |
15.60 |
15.43 - 15.75 |
0.992 times |
Fri 10 October 2025 |
15.54 (-0.51%) |
15.77 |
15.49 - 15.89 |
0.993 times |
Thu 09 October 2025 |
15.62 (-0.95%) |
15.83 |
15.51 - 15.88 |
0.697 times |
Wed 08 October 2025 |
15.77 (1.55%) |
15.56 |
15.46 - 15.84 |
1.0639 times |
Tue 07 October 2025 |
15.53 (-1.83%) |
15.89 |
15.46 - 15.89 |
1.4716 times |
Mon 06 October 2025 |
15.82 (-2.29%) |
16.28 |
15.74 - 16.28 |
0.5761 times |
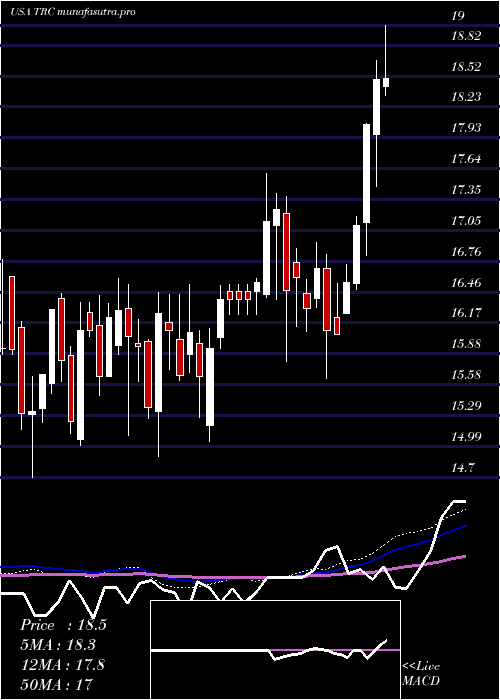
Weekly price and charts TejonRanch Strong weekly Stock price targets for TejonRanch TRC are 15.67 and 16 | Weekly Target 1 | 15.41 | | Weekly Target 2 | 15.6 | | Weekly Target 3 | 15.74 | | Weekly Target 4 | 15.93 | | Weekly Target 5 | 16.07 |
Weekly price and volumes for Tejon Ranch
| Date |
Closing |
Open |
Range |
Volume |
Mon 20 October 2025 |
15.79 (1.61%) |
15.63 |
15.55 - 15.88 |
0.208 times |
Fri 17 October 2025 |
15.54 (0%) |
15.60 |
15.43 - 16.03 |
1.176 times |
Fri 10 October 2025 |
15.54 (-4.01%) |
16.28 |
15.46 - 16.28 |
1.1508 times |
Fri 03 October 2025 |
16.19 (0.62%) |
16.11 |
15.65 - 16.42 |
1.0697 times |
Fri 26 September 2025 |
16.09 (-1.05%) |
16.20 |
15.77 - 16.30 |
1.2337 times |
Fri 19 September 2025 |
16.26 (-2.46%) |
16.70 |
16.20 - 16.76 |
1.6552 times |
Fri 12 September 2025 |
16.67 (0.42%) |
16.53 |
16.45 - 17.01 |
1.2458 times |
Fri 05 September 2025 |
16.60 (-4.65%) |
17.29 |
16.42 - 17.41 |
1.0632 times |
Fri 29 August 2025 |
17.41 (0%) |
17.47 |
17.36 - 17.55 |
0.2094 times |
Fri 29 August 2025 |
17.41 (-0.46%) |
17.56 |
17.17 - 17.57 |
0.9883 times |
Fri 22 August 2025 |
17.49 (0.29%) |
17.46 |
16.91 - 17.76 |
1.5073 times |
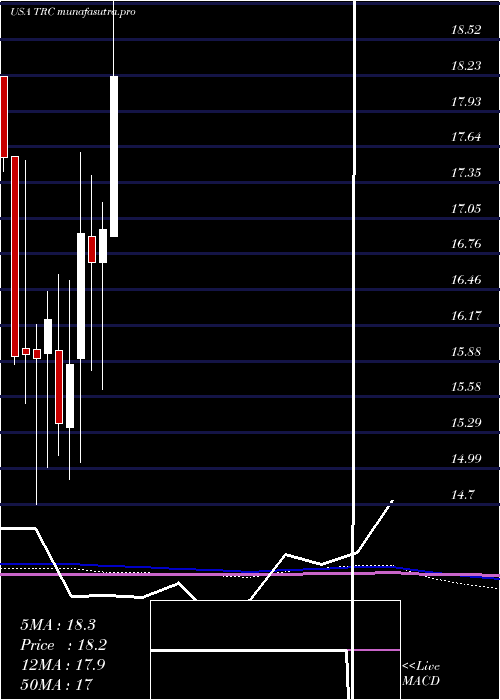
Monthly price and charts TejonRanch Strong monthly Stock price targets for TejonRanch TRC are 15.12 and 16.11 | Monthly Target 1 | 14.89 | | Monthly Target 2 | 15.34 | | Monthly Target 3 | 15.88 | | Monthly Target 4 | 16.33 | | Monthly Target 5 | 16.87 |
Monthly price and volumes Tejon Ranch
| Date |
Closing |
Open |
Range |
Volume |
Mon 20 October 2025 |
15.79 (-1.19%) |
15.87 |
15.43 - 16.42 |
0.6225 times |
Tue 30 September 2025 |
15.98 (-8.21%) |
17.29 |
15.69 - 17.41 |
1.098 times |
Fri 29 August 2025 |
17.41 (-3.06%) |
17.87 |
16.71 - 18.57 |
1.0957 times |
Thu 31 July 2025 |
17.96 (5.9%) |
16.90 |
16.90 - 19.39 |
1.0121 times |
Mon 30 June 2025 |
16.96 (1.62%) |
16.69 |
15.64 - 17.18 |
0.9708 times |
Fri 30 May 2025 |
16.69 (-1.42%) |
16.90 |
15.80 - 17.40 |
1.1413 times |
Wed 30 April 2025 |
16.93 (6.81%) |
15.90 |
15.04 - 17.59 |
1.1872 times |
Mon 31 March 2025 |
15.85 (3.19%) |
15.33 |
14.90 - 16.54 |
1.202 times |
Fri 28 February 2025 |
15.36 (-5.3%) |
15.96 |
15.10 - 16.59 |
0.8725 times |
Fri 31 January 2025 |
16.22 (2.01%) |
15.94 |
15.00 - 16.45 |
0.7978 times |
Tue 31 December 2024 |
15.90 (-0.19%) |
15.97 |
14.70 - 16.18 |
0.8429 times |
DMA SMA EMA moving averages of Tejon Ranch TRC
DMA (daily moving average) of Tejon Ranch TRC
| DMA period | DMA value | | 5 day DMA | 15.74 | | 12 day DMA | 15.73 | | 20 day DMA | 15.83 | | 35 day DMA | 16.17 | | 50 day DMA | 16.53 | | 100 day DMA | 16.98 | | 150 day DMA | 16.78 | | 200 day DMA | 16.56 | EMA (exponential moving average) of Tejon Ranch TRC
| EMA period | EMA current | EMA prev | EMA prev2 | | 5 day EMA | 15.71 | 15.67 | 15.74 | | 12 day EMA | 15.76 | 15.76 | 15.8 | | 20 day EMA | 15.89 | 15.9 | 15.94 | | 35 day EMA | 16.21 | 16.23 | 16.27 | | 50 day EMA | 16.55 | 16.58 | 16.62 |
SMA (simple moving average) of Tejon Ranch TRC
| SMA period | SMA current | SMA prev | SMA prev2 | | 5 day SMA | 15.74 | 15.7 | 15.7 | | 12 day SMA | 15.73 | 15.73 | 15.76 | | 20 day SMA | 15.83 | 15.84 | 15.88 | | 35 day SMA | 16.17 | 16.22 | 16.27 | | 50 day SMA | 16.53 | 16.57 | 16.6 | | 100 day SMA | 16.98 | 16.99 | 17 | | 150 day SMA | 16.78 | 16.78 | 16.79 | | 200 day SMA | 16.56 | 16.56 | 16.56 |
|
|
