TriplepointVenture TPVG full analysis,charts,indicators,moving averages,SMA,DMA,EMA,ADX,MACD,RSITriplepoint Venture TPVG WideScreen charts, DMA,SMA,EMA technical analysis, forecast prediction, by indicators ADX,MACD,RSI,CCI USA stock exchange
operates under N A sector & deals in N A
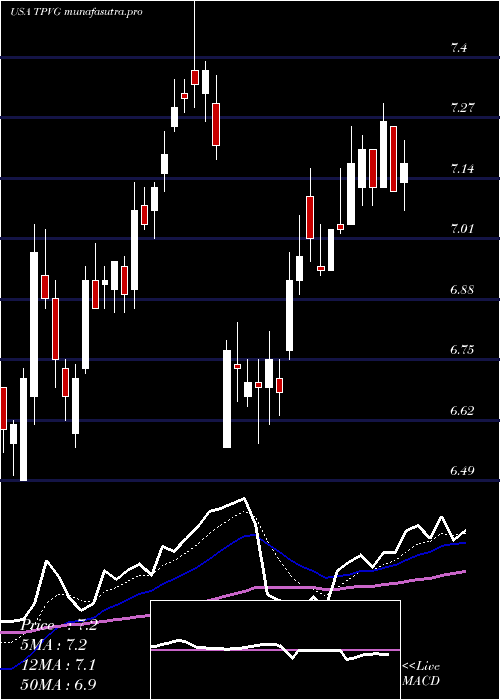
Daily price and charts and targets TriplepointVenture Strong Daily Stock price targets for TriplepointVenture TPVG are 5.52 and 5.64 | Daily Target 1 | 5.48 | | Daily Target 2 | 5.55 | | Daily Target 3 | 5.6 | | Daily Target 4 | 5.67 | | Daily Target 5 | 5.72 |
Daily price and volume Triplepoint Venture
| Date |
Closing |
Open |
Range |
Volume |
Mon 20 October 2025 |
5.62 (0.72%) |
5.63 |
5.53 - 5.65 |
0.867 times |
Fri 17 October 2025 |
5.58 (1.27%) |
5.51 |
5.48 - 5.62 |
0.8573 times |
Thu 16 October 2025 |
5.51 (-0.72%) |
5.55 |
5.49 - 5.61 |
0.6869 times |
Wed 15 October 2025 |
5.55 (3.16%) |
5.40 |
5.40 - 5.63 |
1.2798 times |
Tue 14 October 2025 |
5.38 (0.75%) |
5.26 |
5.26 - 5.45 |
1.0176 times |
Mon 13 October 2025 |
5.34 (-4.13%) |
5.25 |
5.24 - 5.39 |
1.0298 times |
Tue 07 October 2025 |
5.57 (-0.54%) |
5.59 |
5.49 - 5.67 |
1.0442 times |
Mon 06 October 2025 |
5.60 (-1.41%) |
5.79 |
5.55 - 5.79 |
1.5589 times |
Fri 03 October 2025 |
5.68 (-3.89%) |
5.78 |
5.68 - 5.82 |
0.9487 times |
Thu 02 October 2025 |
5.91 (3.68%) |
5.73 |
5.70 - 5.99 |
0.7097 times |
Wed 01 October 2025 |
5.70 (-1.21%) |
5.70 |
5.66 - 5.79 |
1.199 times |
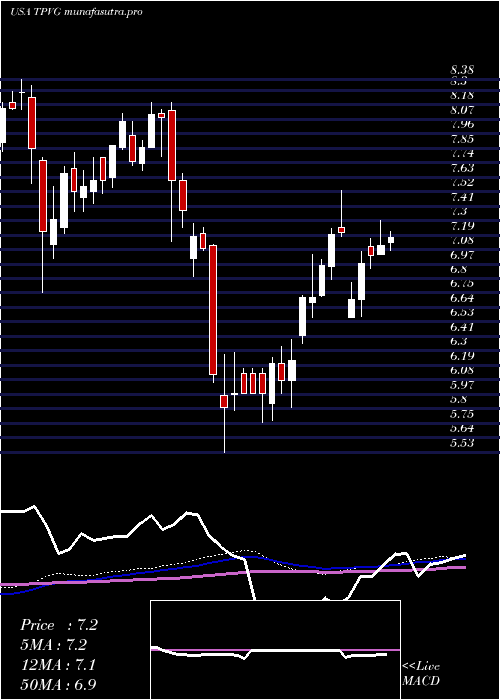
Weekly price and charts TriplepointVenture Strong weekly Stock price targets for TriplepointVenture TPVG are 5.52 and 5.64 | Weekly Target 1 | 5.48 | | Weekly Target 2 | 5.55 | | Weekly Target 3 | 5.6 | | Weekly Target 4 | 5.67 | | Weekly Target 5 | 5.72 |
Weekly price and volumes for Triplepoint Venture
| Date |
Closing |
Open |
Range |
Volume |
Mon 20 October 2025 |
5.62 (0.72%) |
5.63 |
5.53 - 5.65 |
0.1918 times |
Fri 17 October 2025 |
5.58 (0.18%) |
5.25 |
5.24 - 5.63 |
1.0779 times |
Tue 07 October 2025 |
5.57 (-1.94%) |
5.79 |
5.49 - 5.79 |
0.576 times |
Fri 03 October 2025 |
5.68 (-2.57%) |
5.85 |
5.66 - 5.99 |
1.1811 times |
Fri 26 September 2025 |
5.83 (-6.72%) |
6.18 |
5.82 - 6.26 |
1.1174 times |
Fri 19 September 2025 |
6.25 (-5.45%) |
6.62 |
6.05 - 6.75 |
2.1853 times |
Fri 12 September 2025 |
6.61 (-3.22%) |
6.83 |
6.56 - 6.85 |
0.9589 times |
Fri 05 September 2025 |
6.83 (0.74%) |
6.73 |
6.65 - 6.88 |
0.8452 times |
Fri 29 August 2025 |
6.78 (0%) |
6.77 |
6.68 - 6.85 |
0.3214 times |
Fri 29 August 2025 |
6.78 (5.44%) |
6.46 |
6.43 - 6.85 |
1.5447 times |
Fri 22 August 2025 |
6.43 (2.72%) |
6.29 |
6.01 - 6.50 |
1.285 times |
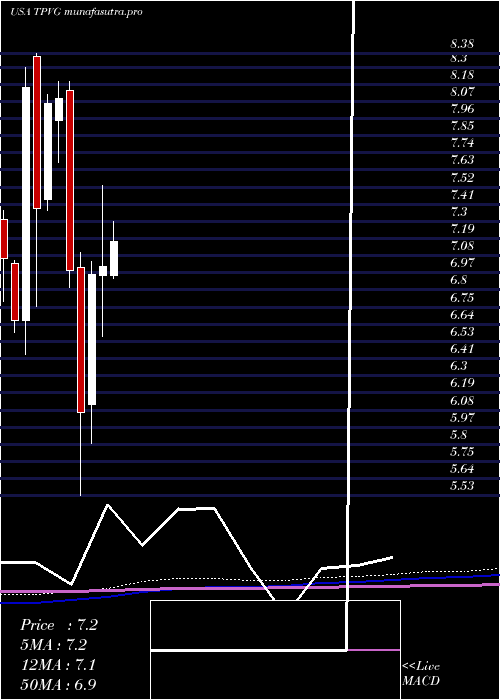
Monthly price and charts TriplepointVenture Strong monthly Stock price targets for TriplepointVenture TPVG are 5.06 and 5.81 | Monthly Target 1 | 4.87 | | Monthly Target 2 | 5.24 | | Monthly Target 3 | 5.6166666666667 | | Monthly Target 4 | 5.99 | | Monthly Target 5 | 6.37 |
Monthly price and volumes Triplepoint Venture
| Date |
Closing |
Open |
Range |
Volume |
Mon 20 October 2025 |
5.62 (-2.6%) |
5.70 |
5.24 - 5.99 |
0.5806 times |
Tue 30 September 2025 |
5.77 (-14.9%) |
6.73 |
5.71 - 6.88 |
1.325 times |
Fri 29 August 2025 |
6.78 (-1.45%) |
6.84 |
6.01 - 6.97 |
1.4628 times |
Thu 31 July 2025 |
6.88 (-1.85%) |
6.95 |
6.82 - 7.50 |
0.9449 times |
Mon 30 June 2025 |
7.01 (0.72%) |
6.95 |
6.56 - 7.53 |
0.7454 times |
Fri 30 May 2025 |
6.96 (14.66%) |
6.12 |
5.87 - 7.04 |
0.8818 times |
Wed 30 April 2025 |
6.07 (-13.04%) |
7.00 |
5.53 - 7.10 |
1.2971 times |
Mon 31 March 2025 |
6.98 (-13.72%) |
8.14 |
6.87 - 8.20 |
1.1565 times |
Fri 28 February 2025 |
8.09 (0.37%) |
7.95 |
7.68 - 8.20 |
0.6122 times |
Fri 31 January 2025 |
8.06 (9.21%) |
7.44 |
7.37 - 8.12 |
0.9937 times |
Tue 31 December 2024 |
7.38 (-9.56%) |
8.36 |
6.75 - 8.38 |
1.9384 times |
DMA SMA EMA moving averages of Triplepoint Venture TPVG
DMA (daily moving average) of Triplepoint Venture TPVG
| DMA period | DMA value | | 5 day DMA | 5.53 | | 12 day DMA | 5.6 | | 20 day DMA | 5.76 | | 35 day DMA | 6.14 | | 50 day DMA | 6.2 | | 100 day DMA | 6.61 | | 150 day DMA | 6.57 | | 200 day DMA | 6.86 | EMA (exponential moving average) of Triplepoint Venture TPVG
| EMA period | EMA current | EMA prev | EMA prev2 | | 5 day EMA | 5.57 | 5.54 | 5.52 | | 12 day EMA | 5.64 | 5.64 | 5.65 | | 20 day EMA | 5.78 | 5.8 | 5.82 | | 35 day EMA | 5.97 | 5.99 | 6.01 | | 50 day EMA | 6.18 | 6.2 | 6.23 |
SMA (simple moving average) of Triplepoint Venture TPVG
| SMA period | SMA current | SMA prev | SMA prev2 | | 5 day SMA | 5.53 | 5.47 | 5.47 | | 12 day SMA | 5.6 | 5.61 | 5.63 | | 20 day SMA | 5.76 | 5.78 | 5.82 | | 35 day SMA | 6.14 | 6.17 | 6.19 | | 50 day SMA | 6.2 | 6.22 | 6.25 | | 100 day SMA | 6.61 | 6.62 | 6.64 | | 150 day SMA | 6.57 | 6.58 | 6.59 | | 200 day SMA | 6.86 | 6.87 | 6.88 |
|
|
