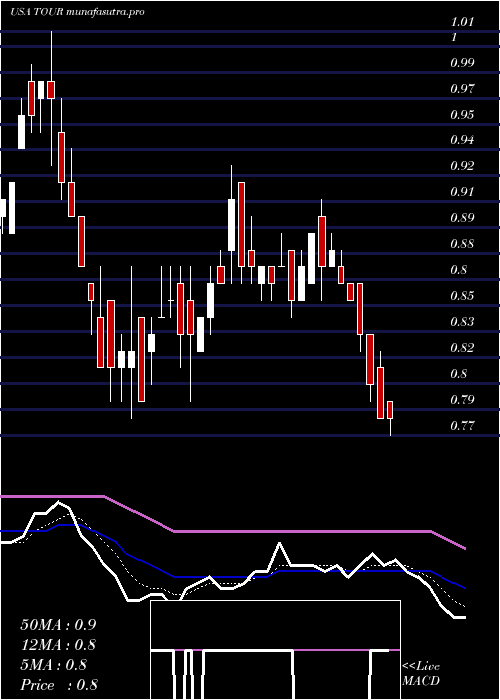
TuniuCorporation TOUR full analysis,charts,indicators,moving averages,SMA,DMA,EMA,ADX,MACD,RSITuniu Corporation TOUR WideScreen charts, DMA,SMA,EMA technical analysis, forecast prediction, by indicators ADX,MACD,RSI,CCI USA stock exchange
operates under Consumer Services sector & deals in Transportation Services
Daily price and charts and targets TuniuCorporation Strong Daily Stock price targets for TuniuCorporation TOUR are 0.75 and 0.76 | Daily Target 1 | 0.74 | | Daily Target 2 | 0.75 | | Daily Target 3 | 0.75333333333333 | | Daily Target 4 | 0.76 | | Daily Target 5 | 0.76 |
Daily price and volume Tuniu Corporation
| Date |
Closing |
Open |
Range |
Volume |
Thu 04 December 2025 |
0.75 (1.35%) |
0.76 |
0.75 - 0.76 |
1.0034 times |
Wed 03 December 2025 |
0.74 (1.37%) |
0.74 |
0.72 - 0.75 |
0.4147 times |
Tue 02 December 2025 |
0.73 (0%) |
0.72 |
0.71 - 0.77 |
1.3808 times |
Mon 01 December 2025 |
0.73 (0%) |
0.73 |
0.73 - 0.77 |
1.0702 times |
Fri 28 November 2025 |
0.73 (-1.35%) |
0.75 |
0.72 - 0.76 |
1.031 times |
Wed 26 November 2025 |
0.74 (4.23%) |
0.71 |
0.71 - 0.77 |
0.8036 times |
Tue 25 November 2025 |
0.71 (-1.39%) |
0.75 |
0.70 - 0.75 |
1.42 times |
Mon 24 November 2025 |
0.72 (-2.7%) |
0.72 |
0.72 - 0.78 |
1.0234 times |
Fri 21 November 2025 |
0.74 (0%) |
0.73 |
0.71 - 0.76 |
0.8877 times |
Thu 20 November 2025 |
0.74 (-1.33%) |
0.75 |
0.74 - 0.76 |
0.9651 times |
Wed 19 November 2025 |
0.75 (0%) |
0.79 |
0.74 - 0.79 |
1.1629 times |
Weekly price and charts TuniuCorporation Strong weekly Stock price targets for TuniuCorporation TOUR are 0.73 and 0.79 | Weekly Target 1 | 0.68 | | Weekly Target 2 | 0.72 | | Weekly Target 3 | 0.74333333333333 | | Weekly Target 4 | 0.78 | | Weekly Target 5 | 0.8 |
Weekly price and volumes for Tuniu Corporation
| Date |
Closing |
Open |
Range |
Volume |
Thu 04 December 2025 |
0.75 (2.74%) |
0.73 |
0.71 - 0.77 |
0.6169 times |
Fri 28 November 2025 |
0.73 (-1.35%) |
0.72 |
0.70 - 0.78 |
0.6821 times |
Fri 21 November 2025 |
0.74 (-1.33%) |
0.75 |
0.71 - 0.79 |
0.7514 times |
Fri 14 November 2025 |
0.75 (-7.41%) |
0.83 |
0.75 - 0.85 |
0.9756 times |
Fri 07 November 2025 |
0.81 (-3.57%) |
0.83 |
0.79 - 0.86 |
0.8087 times |
Fri 31 October 2025 |
0.84 (0%) |
0.84 |
0.84 - 0.87 |
0.1881 times |
Fri 31 October 2025 |
0.84 (0%) |
0.85 |
0.83 - 0.87 |
0.9532 times |
Fri 24 October 2025 |
0.84 (-1.18%) |
0.84 |
0.81 - 0.86 |
0.6066 times |
Fri 17 October 2025 |
0.85 (1.19%) |
0.87 |
0.79 - 0.89 |
2.3755 times |
Fri 10 October 2025 |
0.84 (-12.5%) |
0.90 |
0.83 - 0.95 |
2.0419 times |
Fri 03 October 2025 |
0.96 (5.49%) |
0.92 |
0.92 - 0.98 |
2.293 times |

Monthly price and charts TuniuCorporation Strong monthly Stock price targets for TuniuCorporation TOUR are 0.73 and 0.79 | Monthly Target 1 | 0.68 | | Monthly Target 2 | 0.72 | | Monthly Target 3 | 0.74333333333333 | | Monthly Target 4 | 0.78 | | Monthly Target 5 | 0.8 |
Monthly price and volumes Tuniu Corporation
| Date |
Closing |
Open |
Range |
Volume |
Thu 04 December 2025 |
0.75 (2.74%) |
0.73 |
0.71 - 0.77 |
0.1058 times |
Fri 28 November 2025 |
0.73 (-13.1%) |
0.83 |
0.70 - 0.86 |
0.5521 times |
Fri 31 October 2025 |
0.84 (-11.58%) |
0.97 |
0.79 - 0.98 |
1.2253 times |
Tue 30 September 2025 |
0.95 (9.2%) |
0.87 |
0.85 - 0.98 |
1.6318 times |
Fri 29 August 2025 |
0.87 (11.54%) |
0.79 |
0.75 - 0.89 |
1.3341 times |
Thu 31 July 2025 |
0.78 (-7.14%) |
0.85 |
0.78 - 0.93 |
1.3615 times |
Mon 30 June 2025 |
0.84 (-7.69%) |
0.91 |
0.78 - 1.01 |
1.0155 times |
Fri 30 May 2025 |
0.91 (-1.09%) |
0.91 |
0.88 - 1.00 |
0.6524 times |
Wed 30 April 2025 |
0.92 (-16.36%) |
1.11 |
0.80 - 1.11 |
0.9171 times |
Mon 31 March 2025 |
1.10 (7.84%) |
1.00 |
1.00 - 1.17 |
1.2044 times |
Fri 28 February 2025 |
1.02 (3.03%) |
0.98 |
0.96 - 1.09 |
1.1625 times |

DMA SMA EMA moving averages of Tuniu Corporation TOUR
DMA (daily moving average) of Tuniu Corporation TOUR
| DMA period | DMA value | | 5 day DMA | 0.74 | | 12 day DMA | 0.74 | | 20 day DMA | 0.76 | | 35 day DMA | 0.79 | | 50 day DMA | 0.83 | | 100 day DMA | 0.84 | | 150 day DMA | 0.86 | | 200 day DMA | 0.89 | EMA (exponential moving average) of Tuniu Corporation TOUR
| EMA period | EMA current | EMA prev | EMA prev2 | | 5 day EMA | 0.74 | 0.73 | 0.73 | | 12 day EMA | 0.75 | 0.75 | 0.75 | | 20 day EMA | 0.77 | 0.77 | 0.77 | | 35 day EMA | 0.8 | 0.8 | 0.8 | | 50 day EMA | 0.85 | 0.85 | 0.85 |
SMA (simple moving average) of Tuniu Corporation TOUR
| SMA period | SMA current | SMA prev | SMA prev2 | | 5 day SMA | 0.74 | 0.73 | 0.73 | | 12 day SMA | 0.74 | 0.74 | 0.74 | | 20 day SMA | 0.76 | 0.76 | 0.76 | | 35 day SMA | 0.79 | 0.79 | 0.8 | | 50 day SMA | 0.83 | 0.83 | 0.84 | | 100 day SMA | 0.84 | 0.84 | 0.85 | | 150 day SMA | 0.86 | 0.86 | 0.86 | | 200 day SMA | 0.89 | 0.89 | 0.9 |
|
|
