TollBrothers TOL full analysis,charts,indicators,moving averages,SMA,DMA,EMA,ADX,MACD,RSIToll Brothers TOL WideScreen charts, DMA,SMA,EMA technical analysis, forecast prediction, by indicators ADX,MACD,RSI,CCI USA stock exchange
operates under Capital Goods sector & deals in Homebuilding
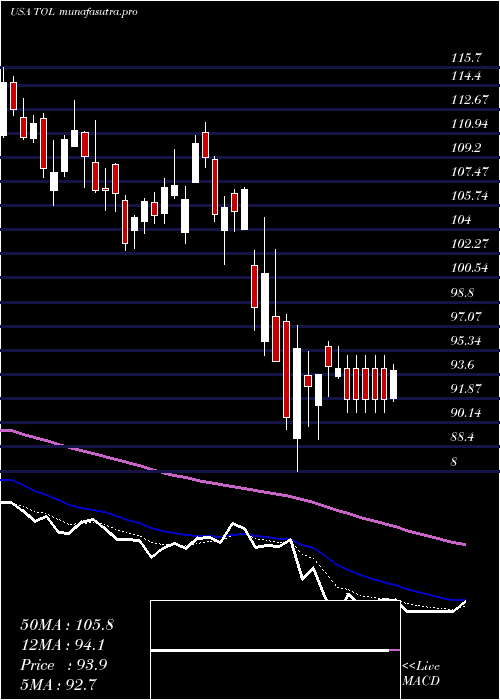
Daily price and charts and targets TollBrothers Strong Daily Stock price targets for TollBrothers TOL are 134.45 and 136.87 | Daily Target 1 | 134.02 | | Daily Target 2 | 134.87 | | Daily Target 3 | 136.44 | | Daily Target 4 | 137.29 | | Daily Target 5 | 138.86 |
Daily price and volume Toll Brothers
| Date |
Closing |
Open |
Range |
Volume |
Mon 20 October 2025 |
135.72 (0.01%) |
136.59 |
135.59 - 138.01 |
0.9289 times |
Fri 17 October 2025 |
135.71 (1.01%) |
133.93 |
133.56 - 136.40 |
1.1851 times |
Thu 16 October 2025 |
134.35 (0.04%) |
134.96 |
132.86 - 135.20 |
0.9608 times |
Wed 15 October 2025 |
134.30 (0.77%) |
133.20 |
133.00 - 134.84 |
1.1094 times |
Tue 14 October 2025 |
133.28 (4.39%) |
126.79 |
126.71 - 133.83 |
1.3733 times |
Mon 13 October 2025 |
127.67 (-3.91%) |
127.14 |
126.55 - 128.14 |
0.7083 times |
Tue 07 October 2025 |
132.86 (-7.45%) |
137.52 |
132.63 - 138.11 |
1.5083 times |
Mon 06 October 2025 |
143.55 (0.58%) |
143.73 |
140.48 - 143.86 |
0.7356 times |
Fri 03 October 2025 |
142.72 (2.27%) |
140.09 |
139.79 - 143.49 |
0.9667 times |
Thu 02 October 2025 |
139.55 (-0.29%) |
140.50 |
137.38 - 140.50 |
0.5235 times |
Wed 01 October 2025 |
139.95 (1.31%) |
138.60 |
138.03 - 140.33 |
0.8935 times |
Weekly price and charts TollBrothers Strong weekly Stock price targets for TollBrothers TOL are 134.45 and 136.87 | Weekly Target 1 | 134.02 | | Weekly Target 2 | 134.87 | | Weekly Target 3 | 136.44 | | Weekly Target 4 | 137.29 | | Weekly Target 5 | 138.86 |
Weekly price and volumes for Toll Brothers
| Date |
Closing |
Open |
Range |
Volume |
Mon 20 October 2025 |
135.72 (0.01%) |
136.59 |
135.59 - 138.01 |
0.1825 times |
Fri 17 October 2025 |
135.71 (2.15%) |
127.14 |
126.55 - 136.40 |
1.0485 times |
Tue 07 October 2025 |
132.86 (-6.91%) |
143.73 |
132.63 - 143.86 |
0.4408 times |
Fri 03 October 2025 |
142.72 (4.01%) |
138.48 |
136.00 - 143.49 |
0.8271 times |
Fri 26 September 2025 |
137.22 (-1.77%) |
138.58 |
133.82 - 139.09 |
1.1268 times |
Fri 19 September 2025 |
139.69 (-2.63%) |
144.40 |
137.00 - 145.96 |
1.8364 times |
Fri 12 September 2025 |
143.47 (-2.65%) |
146.25 |
142.33 - 148.51 |
1.4605 times |
Fri 05 September 2025 |
147.37 (6.02%) |
136.17 |
135.57 - 149.79 |
1.6935 times |
Fri 29 August 2025 |
139.00 (0%) |
138.53 |
137.65 - 139.52 |
0.2236 times |
Fri 29 August 2025 |
139.00 (-0.12%) |
138.50 |
136.84 - 139.52 |
1.1603 times |
Fri 22 August 2025 |
139.17 (6.64%) |
130.79 |
129.71 - 140.86 |
2.378 times |
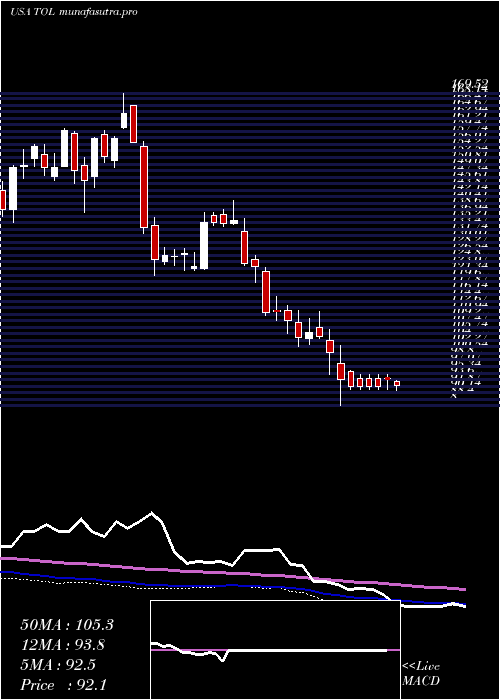
Monthly price and charts TollBrothers Strong monthly Stock price targets for TollBrothers TOL are 122.48 and 139.79 | Monthly Target 1 | 118.07 | | Monthly Target 2 | 126.89 | | Monthly Target 3 | 135.37666666667 | | Monthly Target 4 | 144.2 | | Monthly Target 5 | 152.69 |
Monthly price and volumes Toll Brothers
| Date |
Closing |
Open |
Range |
Volume |
Mon 20 October 2025 |
135.72 (-1.75%) |
138.60 |
126.55 - 143.86 |
0.3416 times |
Tue 30 September 2025 |
138.14 (-0.62%) |
136.17 |
133.82 - 149.79 |
1.0337 times |
Fri 29 August 2025 |
139.00 (17.44%) |
119.91 |
117.71 - 140.86 |
1.0168 times |
Thu 31 July 2025 |
118.36 (3.71%) |
113.53 |
113.52 - 129.06 |
1.1182 times |
Mon 30 June 2025 |
114.13 (9.48%) |
103.10 |
100.92 - 116.28 |
0.9843 times |
Fri 30 May 2025 |
104.25 (3.35%) |
101.08 |
99.12 - 110.67 |
1.0894 times |
Wed 30 April 2025 |
100.87 (-4.47%) |
106.59 |
86.67 - 107.01 |
1.1591 times |
Mon 31 March 2025 |
105.59 (-5.42%) |
111.99 |
101.50 - 113.30 |
1.0815 times |
Fri 28 February 2025 |
111.64 (-17.8%) |
133.00 |
109.24 - 136.36 |
1.1934 times |
Fri 31 January 2025 |
135.81 (7.83%) |
127.42 |
122.56 - 141.15 |
0.982 times |
Tue 31 December 2024 |
125.95 (-23.28%) |
156.87 |
121.27 - 156.94 |
0.9154 times |

DMA SMA EMA moving averages of Toll Brothers TOL
DMA (daily moving average) of Toll Brothers TOL
| DMA period | DMA value | | 5 day DMA | 134.67 | | 12 day DMA | 136.48 | | 20 day DMA | 136.89 | | 35 day DMA | 139.32 | | 50 day DMA | 137.1 | | 100 day DMA | 125.78 | | 150 day DMA | 117.55 | | 200 day DMA | 119.17 | EMA (exponential moving average) of Toll Brothers TOL
| EMA period | EMA current | EMA prev | EMA prev2 | | 5 day EMA | 135.1 | 134.79 | 134.33 | | 12 day EMA | 135.89 | 135.92 | 135.96 | | 20 day EMA | 136.62 | 136.71 | 136.81 | | 35 day EMA | 136.02 | 136.04 | 136.06 | | 50 day EMA | 135.68 | 135.68 | 135.68 |
SMA (simple moving average) of Toll Brothers TOL
| SMA period | SMA current | SMA prev | SMA prev2 | | 5 day SMA | 134.67 | 133.06 | 132.49 | | 12 day SMA | 136.48 | 136.7 | 136.82 | | 20 day SMA | 136.89 | 137.11 | 137.39 | | 35 day SMA | 139.32 | 139.38 | 139.44 | | 50 day SMA | 137.1 | 136.9 | 136.73 | | 100 day SMA | 125.78 | 125.46 | 125.15 | | 150 day SMA | 117.55 | 117.35 | 117.16 | | 200 day SMA | 119.17 | 119.12 | 119.08 |
|
|
