TrinetGroup TNET full analysis,charts,indicators,moving averages,SMA,DMA,EMA,ADX,MACD,RSITrinet Group TNET WideScreen charts, DMA,SMA,EMA technical analysis, forecast prediction, by indicators ADX,MACD,RSI,CCI USA stock exchange
operates under Miscellaneous sector & deals in Business Services
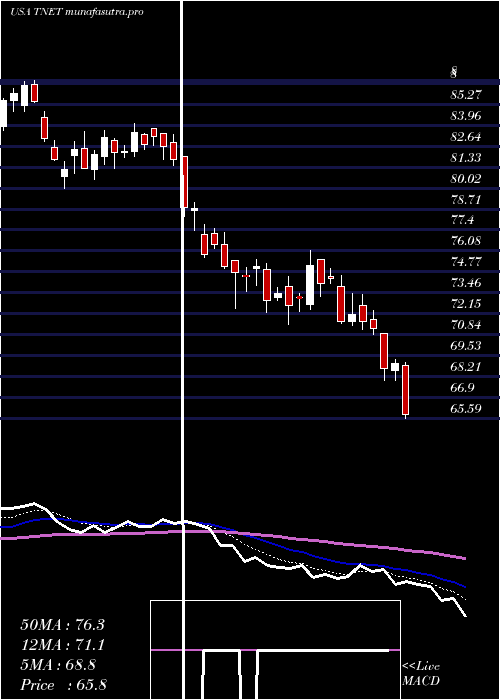
Daily price and charts and targets TrinetGroup Strong Daily Stock price targets for TrinetGroup TNET are 60.23 and 61.66 | Daily Target 1 | 59.92 | | Daily Target 2 | 60.54 | | Daily Target 3 | 61.346666666667 | | Daily Target 4 | 61.97 | | Daily Target 5 | 62.78 |
Daily price and volume Trinet Group
| Date |
Closing |
Open |
Range |
Volume |
Mon 20 October 2025 |
61.17 (-0.07%) |
61.41 |
60.72 - 62.15 |
0.7304 times |
Fri 17 October 2025 |
61.21 (1.26%) |
60.40 |
60.40 - 61.42 |
0.7872 times |
Thu 16 October 2025 |
60.45 (-0.79%) |
60.80 |
57.83 - 61.44 |
1.6814 times |
Wed 15 October 2025 |
60.93 (-5.81%) |
63.10 |
60.89 - 63.85 |
1.1665 times |
Tue 07 October 2025 |
64.69 (-2.24%) |
66.47 |
64.55 - 66.50 |
0.8039 times |
Mon 06 October 2025 |
66.17 (0.23%) |
66.48 |
65.51 - 67.45 |
0.6309 times |
Fri 03 October 2025 |
66.02 (2.67%) |
64.43 |
64.43 - 66.61 |
1.1554 times |
Thu 02 October 2025 |
64.30 (-1.76%) |
64.81 |
64.07 - 65.34 |
0.734 times |
Wed 01 October 2025 |
65.45 (-2.15%) |
65.93 |
64.92 - 66.63 |
0.8289 times |
Tue 30 September 2025 |
66.89 (-1.7%) |
67.94 |
65.80 - 68.21 |
1.4814 times |
Mon 29 September 2025 |
68.05 (0.7%) |
67.89 |
66.87 - 68.40 |
1.0608 times |
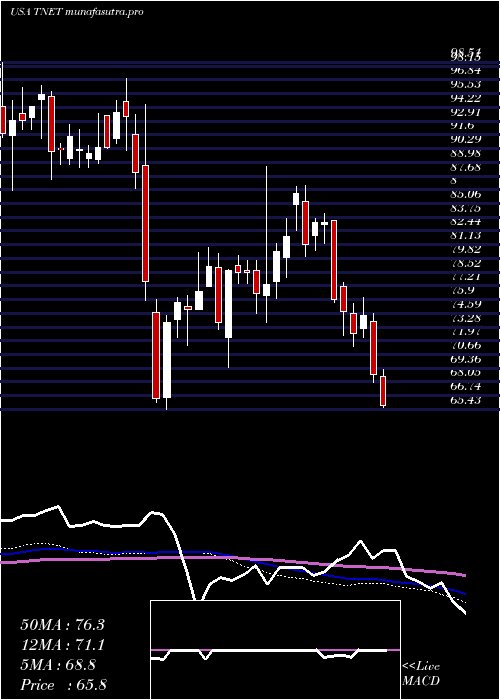
Weekly price and charts TrinetGroup Strong weekly Stock price targets for TrinetGroup TNET are 60.23 and 61.66 | Weekly Target 1 | 59.92 | | Weekly Target 2 | 60.54 | | Weekly Target 3 | 61.346666666667 | | Weekly Target 4 | 61.97 | | Weekly Target 5 | 62.78 |
Weekly price and volumes for Trinet Group
| Date |
Closing |
Open |
Range |
Volume |
Mon 20 October 2025 |
61.17 (-0.07%) |
61.41 |
60.72 - 62.15 |
0.1465 times |
Fri 17 October 2025 |
61.21 (-7.29%) |
66.48 |
57.83 - 67.45 |
1.0165 times |
Fri 03 October 2025 |
66.02 (-2.31%) |
67.89 |
64.07 - 68.40 |
1.0547 times |
Fri 26 September 2025 |
67.58 (-0.68%) |
67.93 |
64.70 - 69.30 |
1.1284 times |
Fri 19 September 2025 |
68.04 (-1.41%) |
69.22 |
67.50 - 70.72 |
1.4049 times |
Fri 12 September 2025 |
69.01 (-2.34%) |
70.46 |
67.36 - 71.75 |
0.9075 times |
Fri 05 September 2025 |
70.66 (-2.43%) |
72.12 |
69.92 - 72.84 |
0.9291 times |
Fri 29 August 2025 |
72.42 (0%) |
71.92 |
71.18 - 72.84 |
0.2481 times |
Fri 29 August 2025 |
72.42 (4.96%) |
68.80 |
67.60 - 72.84 |
1.3377 times |
Fri 22 August 2025 |
69.00 (5.59%) |
65.69 |
65.27 - 69.44 |
1.8264 times |
Fri 15 August 2025 |
65.35 (2.8%) |
63.74 |
62.55 - 67.25 |
1.1873 times |
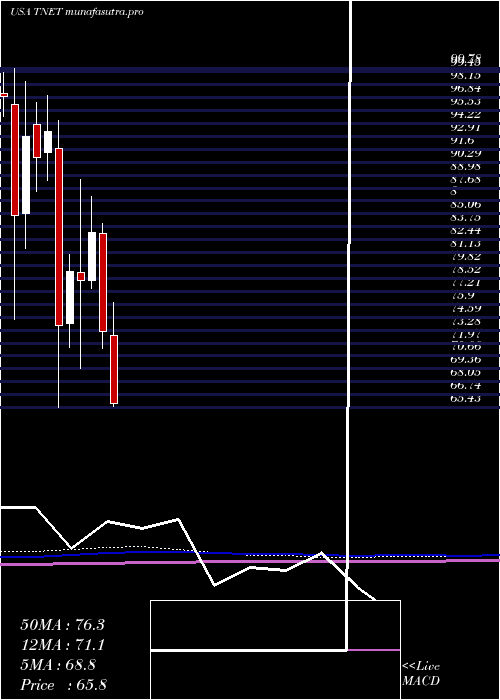
Monthly price and charts TrinetGroup Strong monthly Stock price targets for TrinetGroup TNET are 54.69 and 64.31 | Monthly Target 1 | 52.53 | | Monthly Target 2 | 56.85 | | Monthly Target 3 | 62.15 | | Monthly Target 4 | 66.47 | | Monthly Target 5 | 71.77 |
Monthly price and volumes Trinet Group
| Date |
Closing |
Open |
Range |
Volume |
Mon 20 October 2025 |
61.17 (-8.55%) |
65.93 |
57.83 - 67.45 |
0.3235 times |
Tue 30 September 2025 |
66.89 (-7.64%) |
72.12 |
64.70 - 72.84 |
0.9242 times |
Fri 29 August 2025 |
72.42 (6.8%) |
67.50 |
62.55 - 72.84 |
1.1644 times |
Thu 31 July 2025 |
67.81 (-7.29%) |
72.71 |
63.23 - 76.09 |
1.4217 times |
Mon 30 June 2025 |
73.14 (-12.1%) |
83.04 |
71.47 - 84.08 |
0.8243 times |
Fri 30 May 2025 |
83.21 (6.23%) |
78.30 |
77.51 - 86.78 |
0.747 times |
Wed 30 April 2025 |
78.33 (-1.15%) |
79.07 |
69.40 - 88.56 |
1.1166 times |
Mon 31 March 2025 |
79.24 (7.5%) |
73.96 |
71.50 - 80.91 |
1.4657 times |
Fri 28 February 2025 |
73.71 (-21.07%) |
91.66 |
65.43 - 94.54 |
1.362 times |
Fri 31 January 2025 |
93.39 (2.89%) |
91.24 |
88.49 - 97.02 |
0.6508 times |
Tue 31 December 2024 |
90.77 (-2.32%) |
94.15 |
87.35 - 96.34 |
0.574 times |
DMA SMA EMA moving averages of Trinet Group TNET
DMA (daily moving average) of Trinet Group TNET
| DMA period | DMA value | | 5 day DMA | 61.69 | | 12 day DMA | 64.41 | | 20 day DMA | 65.79 | | 35 day DMA | 67.77 | | 50 day DMA | 67.07 | | 100 day DMA | 70.73 | | 150 day DMA | 73.34 | | 200 day DMA | 76.52 | EMA (exponential moving average) of Trinet Group TNET
| EMA period | EMA current | EMA prev | EMA prev2 | | 5 day EMA | 61.92 | 62.3 | 62.84 | | 12 day EMA | 63.77 | 64.24 | 64.79 | | 20 day EMA | 65.03 | 65.44 | 65.88 | | 35 day EMA | 65.92 | 66.2 | 66.49 | | 50 day EMA | 66.61 | 66.83 | 67.06 |
SMA (simple moving average) of Trinet Group TNET
| SMA period | SMA current | SMA prev | SMA prev2 | | 5 day SMA | 61.69 | 62.69 | 63.65 | | 12 day SMA | 64.41 | 64.77 | 65.34 | | 20 day SMA | 65.79 | 66.15 | 66.54 | | 35 day SMA | 67.77 | 67.98 | 68.21 | | 50 day SMA | 67.07 | 67.11 | 67.24 | | 100 day SMA | 70.73 | 70.98 | 71.23 | | 150 day SMA | 73.34 | 73.43 | 73.52 | | 200 day SMA | 76.52 | 76.66 | 76.81 |
|
|
