TMobile TMUS full analysis,charts,indicators,moving averages,SMA,DMA,EMA,ADX,MACD,RSIT Mobile TMUS WideScreen charts, DMA,SMA,EMA technical analysis, forecast prediction, by indicators ADX,MACD,RSI,CCI USA stock exchange
operates under Public Utilities sector & deals in Telecommunications Equipment
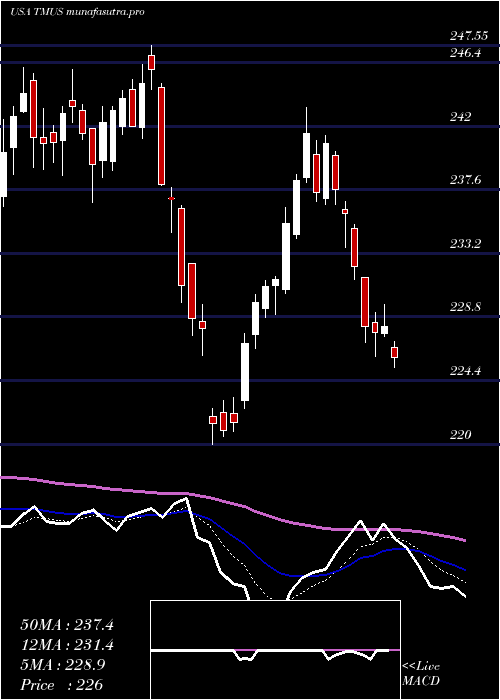
Daily price and charts and targets TMobile Strong Daily Stock price targets for TMobile TMUS are 205.72 and 209.01 | Daily Target 1 | 204.95 | | Daily Target 2 | 206.48 | | Daily Target 3 | 208.24 | | Daily Target 4 | 209.77 | | Daily Target 5 | 211.53 |
Daily price and volume T Mobile
| Date |
Closing |
Open |
Range |
Volume |
Thu 04 December 2025 |
208.01 (-0.24%) |
209.36 |
206.71 - 210.00 |
0.887 times |
Wed 03 December 2025 |
208.51 (-0.77%) |
209.63 |
207.28 - 211.81 |
0.9603 times |
Tue 02 December 2025 |
210.13 (1.69%) |
207.60 |
205.80 - 210.62 |
0.9789 times |
Mon 01 December 2025 |
206.63 (-1.14%) |
208.97 |
205.57 - 209.11 |
0.7265 times |
Fri 28 November 2025 |
209.01 (1.1%) |
206.73 |
206.23 - 210.49 |
0.3923 times |
Wed 26 November 2025 |
206.73 (-0.06%) |
205.77 |
205.33 - 207.40 |
0.9612 times |
Tue 25 November 2025 |
206.86 (-0.23%) |
207.32 |
206.13 - 209.80 |
0.3943 times |
Mon 24 November 2025 |
207.34 (-1.02%) |
208.88 |
205.52 - 209.25 |
1.9271 times |
Fri 21 November 2025 |
209.48 (-0.49%) |
208.04 |
206.68 - 211.36 |
1.5095 times |
Thu 20 November 2025 |
210.51 (-0.36%) |
211.32 |
209.89 - 212.32 |
1.2628 times |
Wed 19 November 2025 |
211.27 (-0.84%) |
212.67 |
210.16 - 213.26 |
0.8846 times |
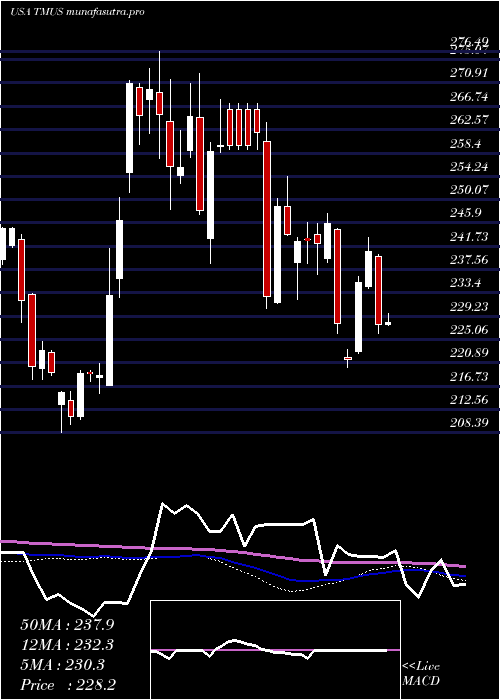
Weekly price and charts TMobile Strong weekly Stock price targets for TMobile TMUS are 203.67 and 209.91 | Weekly Target 1 | 202.22 | | Weekly Target 2 | 205.12 | | Weekly Target 3 | 208.46333333333 | | Weekly Target 4 | 211.36 | | Weekly Target 5 | 214.7 |
Weekly price and volumes for T Mobile
| Date |
Closing |
Open |
Range |
Volume |
Thu 04 December 2025 |
208.01 (-0.48%) |
208.97 |
205.57 - 211.81 |
0.7632 times |
Fri 28 November 2025 |
209.01 (-0.22%) |
208.88 |
205.33 - 210.49 |
0.7895 times |
Fri 21 November 2025 |
209.48 (-3.05%) |
215.91 |
206.68 - 218.33 |
1.2782 times |
Fri 14 November 2025 |
216.08 (4.39%) |
206.19 |
204.47 - 218.18 |
1.0518 times |
Fri 07 November 2025 |
207.00 (-1.45%) |
204.23 |
199.41 - 208.57 |
0.9699 times |
Fri 31 October 2025 |
210.05 (0%) |
209.29 |
207.64 - 211.85 |
0.2557 times |
Fri 31 October 2025 |
210.05 (-3.55%) |
216.98 |
207.64 - 222.83 |
1.5713 times |
Fri 24 October 2025 |
217.77 (-5.11%) |
228.93 |
215.60 - 231.01 |
1.2971 times |
Fri 17 October 2025 |
229.50 (0.31%) |
228.87 |
224.06 - 230.65 |
0.9401 times |
Fri 10 October 2025 |
228.79 (-0.64%) |
230.25 |
222.26 - 231.02 |
1.0832 times |
Fri 03 October 2025 |
230.27 (-3.03%) |
237.46 |
227.11 - 240.95 |
1.0454 times |
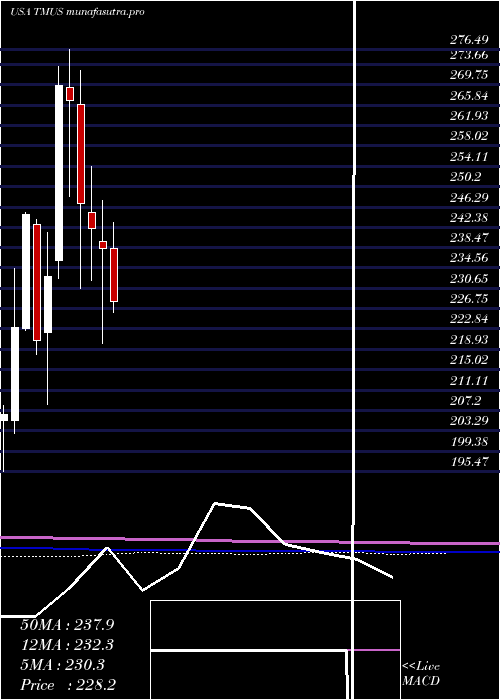
Monthly price and charts TMobile Strong monthly Stock price targets for TMobile TMUS are 203.67 and 209.91 | Monthly Target 1 | 202.22 | | Monthly Target 2 | 205.12 | | Monthly Target 3 | 208.46333333333 | | Monthly Target 4 | 211.36 | | Monthly Target 5 | 214.7 |
Monthly price and volumes T Mobile
| Date |
Closing |
Open |
Range |
Volume |
Thu 04 December 2025 |
208.01 (-0.48%) |
208.97 |
205.57 - 211.81 |
0.1778 times |
Fri 28 November 2025 |
209.01 (-0.5%) |
204.23 |
199.41 - 218.33 |
0.9528 times |
Fri 31 October 2025 |
210.05 (-12.25%) |
239.40 |
207.64 - 240.95 |
1.3441 times |
Tue 30 September 2025 |
239.38 (-5%) |
251.70 |
234.76 - 258.66 |
1.0284 times |
Fri 29 August 2025 |
251.99 (5.7%) |
240.44 |
235.56 - 261.56 |
0.9801 times |
Thu 31 July 2025 |
238.41 (0.06%) |
238.41 |
225.28 - 251.75 |
1.1001 times |
Mon 30 June 2025 |
238.26 (-1.63%) |
239.57 |
220.00 - 247.55 |
1.2044 times |
Fri 30 May 2025 |
242.20 (-1.92%) |
245.27 |
232.24 - 254.16 |
1.0152 times |
Wed 30 April 2025 |
246.95 (-7.41%) |
265.95 |
230.64 - 272.60 |
1.2831 times |
Mon 31 March 2025 |
266.71 (-1.1%) |
269.29 |
248.26 - 276.49 |
0.9139 times |
Fri 28 February 2025 |
269.69 (15.76%) |
235.94 |
232.60 - 273.40 |
0.8494 times |
DMA SMA EMA moving averages of T Mobile TMUS
DMA (daily moving average) of T Mobile TMUS
| DMA period | DMA value | | 5 day DMA | 208.46 | | 12 day DMA | 208.96 | | 20 day DMA | 209.63 | | 35 day DMA | 213.43 | | 50 day DMA | 218.63 | | 100 day DMA | 231.46 | | 150 day DMA | 233.55 | | 200 day DMA | 240.01 | EMA (exponential moving average) of T Mobile TMUS
| EMA period | EMA current | EMA prev | EMA prev2 | | 5 day EMA | 208.38 | 208.57 | 208.6 | | 12 day EMA | 209.1 | 209.3 | 209.44 | | 20 day EMA | 210.54 | 210.81 | 211.05 | | 35 day EMA | 214.9 | 215.31 | 215.71 | | 50 day EMA | 219.24 | 219.7 | 220.16 |
SMA (simple moving average) of T Mobile TMUS
| SMA period | SMA current | SMA prev | SMA prev2 | | 5 day SMA | 208.46 | 208.2 | 207.87 | | 12 day SMA | 208.96 | 209.62 | 210.25 | | 20 day SMA | 209.63 | 209.47 | 209.36 | | 35 day SMA | 213.43 | 213.96 | 214.56 | | 50 day SMA | 218.63 | 219.23 | 219.85 | | 100 day SMA | 231.46 | 231.64 | 231.83 | | 150 day SMA | 233.55 | 233.81 | 234.03 | | 200 day SMA | 240.01 | 240.29 | 240.6 |
|
|
