TaylorMorrison TMHC full analysis,charts,indicators,moving averages,SMA,DMA,EMA,ADX,MACD,RSITaylor Morrison TMHC WideScreen charts, DMA,SMA,EMA technical analysis, forecast prediction, by indicators ADX,MACD,RSI,CCI USA stock exchange
operates under Capital Goods sector & deals in Homebuilding
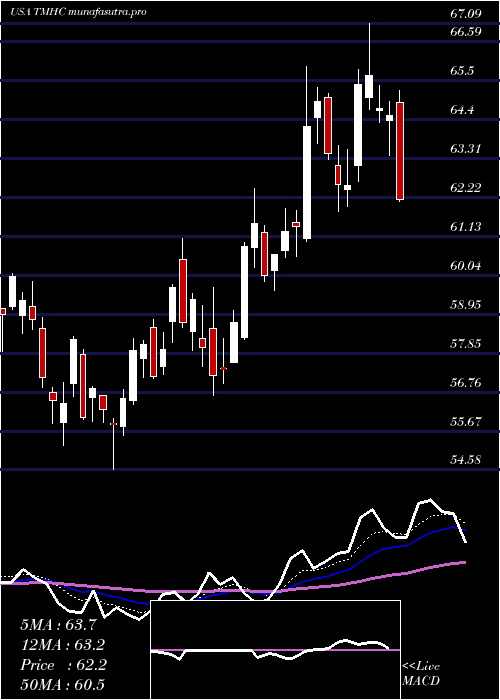
Daily price and charts and targets TaylorMorrison Strong Daily Stock price targets for TaylorMorrison TMHC are 61.79 and 63.02 | Daily Target 1 | 60.85 | | Daily Target 2 | 61.49 | | Daily Target 3 | 62.08 | | Daily Target 4 | 62.72 | | Daily Target 5 | 63.31 |
Daily price and volume Taylor Morrison
| Date |
Closing |
Open |
Range |
Volume |
Mon 20 October 2025 |
62.13 (0.53%) |
62.08 |
61.44 - 62.67 |
1.2699 times |
Fri 17 October 2025 |
61.80 (0.1%) |
61.64 |
60.88 - 62.49 |
1.4728 times |
Thu 16 October 2025 |
61.74 (-1.39%) |
62.62 |
60.78 - 62.92 |
1.5075 times |
Wed 15 October 2025 |
62.61 (-0.52%) |
62.94 |
62.24 - 63.80 |
0.7122 times |
Tue 14 October 2025 |
62.94 (3.86%) |
60.11 |
60.01 - 63.16 |
0.8471 times |
Mon 13 October 2025 |
60.60 (-1.14%) |
61.35 |
60.14 - 61.49 |
0.7019 times |
Fri 10 October 2025 |
61.30 (-1.14%) |
62.54 |
61.06 - 62.54 |
0.6548 times |
Thu 09 October 2025 |
62.01 (-1.51%) |
62.66 |
61.10 - 62.66 |
1.1382 times |
Wed 08 October 2025 |
62.96 (-0.63%) |
63.78 |
62.01 - 63.78 |
0.7897 times |
Tue 07 October 2025 |
63.36 (-4.68%) |
65.48 |
63.24 - 65.83 |
0.9059 times |
Mon 06 October 2025 |
66.47 (-2.15%) |
67.86 |
66.18 - 67.86 |
0.4809 times |
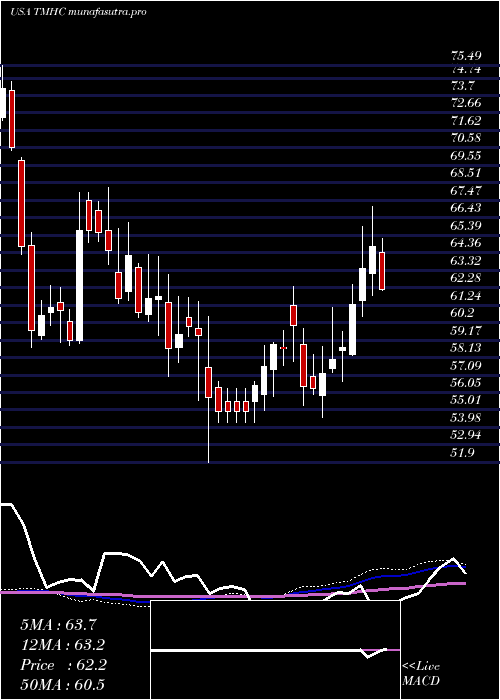
Weekly price and charts TaylorMorrison Strong weekly Stock price targets for TaylorMorrison TMHC are 61.79 and 63.02 | Weekly Target 1 | 60.85 | | Weekly Target 2 | 61.49 | | Weekly Target 3 | 62.08 | | Weekly Target 4 | 62.72 | | Weekly Target 5 | 63.31 |
Weekly price and volumes for Taylor Morrison
| Date |
Closing |
Open |
Range |
Volume |
Mon 20 October 2025 |
62.13 (0.53%) |
62.08 |
61.44 - 62.67 |
0.3832 times |
Fri 17 October 2025 |
61.80 (0.82%) |
61.35 |
60.01 - 63.80 |
1.5816 times |
Fri 10 October 2025 |
61.30 (-9.76%) |
67.86 |
61.06 - 67.86 |
1.1978 times |
Fri 03 October 2025 |
67.93 (2.54%) |
66.44 |
65.29 - 68.55 |
0.6885 times |
Fri 26 September 2025 |
66.25 (-2.23%) |
67.85 |
65.04 - 67.85 |
1.0832 times |
Fri 19 September 2025 |
67.76 (-2.71%) |
70.07 |
67.14 - 71.14 |
1.7109 times |
Fri 12 September 2025 |
69.65 (-3.05%) |
71.49 |
68.98 - 71.93 |
1.1074 times |
Fri 05 September 2025 |
71.84 (6.64%) |
66.14 |
66.14 - 72.50 |
0.9254 times |
Fri 29 August 2025 |
67.37 (0%) |
67.30 |
66.72 - 67.58 |
0.1979 times |
Fri 29 August 2025 |
67.37 (-2.98%) |
68.92 |
66.22 - 68.93 |
1.124 times |
Fri 22 August 2025 |
69.44 (2.15%) |
68.28 |
64.81 - 70.50 |
1.6603 times |
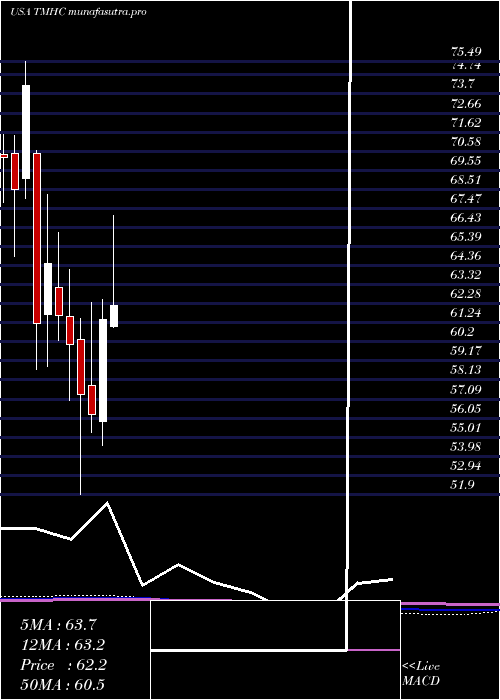
Monthly price and charts TaylorMorrison Strong monthly Stock price targets for TaylorMorrison TMHC are 56.8 and 65.34 | Monthly Target 1 | 55.02 | | Monthly Target 2 | 58.58 | | Monthly Target 3 | 63.563333333333 | | Monthly Target 4 | 67.12 | | Monthly Target 5 | 72.1 |
Monthly price and volumes Taylor Morrison
| Date |
Closing |
Open |
Range |
Volume |
Mon 20 October 2025 |
62.13 (-5.88%) |
65.93 |
60.01 - 68.55 |
0.7442 times |
Tue 30 September 2025 |
66.01 (-2.02%) |
66.14 |
65.04 - 72.50 |
1.0775 times |
Fri 29 August 2025 |
67.37 (13.65%) |
59.74 |
59.53 - 70.50 |
1.1233 times |
Thu 31 July 2025 |
59.28 (-3.48%) |
61.06 |
59.00 - 67.34 |
1.36 times |
Mon 30 June 2025 |
61.42 (9.13%) |
55.87 |
54.58 - 62.49 |
0.8989 times |
Fri 30 May 2025 |
56.28 (-1.87%) |
57.83 |
55.26 - 62.36 |
0.8609 times |
Wed 30 April 2025 |
57.35 (-4.48%) |
60.34 |
51.90 - 61.47 |
0.8996 times |
Mon 31 March 2025 |
60.04 (-2.6%) |
61.59 |
57.03 - 64.14 |
1.087 times |
Fri 28 February 2025 |
61.64 (-4.37%) |
63.17 |
60.29 - 66.17 |
1.0448 times |
Fri 31 January 2025 |
64.46 (5.31%) |
61.69 |
58.85 - 68.23 |
0.9039 times |
Tue 31 December 2024 |
61.21 (-17.43%) |
70.45 |
58.72 - 70.63 |
0.6857 times |
DMA SMA EMA moving averages of Taylor Morrison TMHC
DMA (daily moving average) of Taylor Morrison TMHC
| DMA period | DMA value | | 5 day DMA | 62.24 | | 12 day DMA | 62.99 | | 20 day DMA | 64.32 | | 35 day DMA | 66.37 | | 50 day DMA | 66.76 | | 100 day DMA | 63.95 | | 150 day DMA | 61.96 | | 200 day DMA | 62.15 | EMA (exponential moving average) of Taylor Morrison TMHC
| EMA period | EMA current | EMA prev | EMA prev2 | | 5 day EMA | 62.11 | 62.1 | 62.25 | | 12 day EMA | 62.99 | 63.15 | 63.4 | | 20 day EMA | 63.99 | 64.19 | 64.44 | | 35 day EMA | 65.02 | 65.19 | 65.39 | | 50 day EMA | 66.13 | 66.29 | 66.47 |
SMA (simple moving average) of Taylor Morrison TMHC
| SMA period | SMA current | SMA prev | SMA prev2 | | 5 day SMA | 62.24 | 61.94 | 61.84 | | 12 day SMA | 62.99 | 63.41 | 63.86 | | 20 day SMA | 64.32 | 64.51 | 64.81 | | 35 day SMA | 66.37 | 66.52 | 66.68 | | 50 day SMA | 66.76 | 66.8 | 66.86 | | 100 day SMA | 63.95 | 63.91 | 63.85 | | 150 day SMA | 61.96 | 61.94 | 61.92 | | 200 day SMA | 62.15 | 62.15 | 62.14 |
|
|
